Pressure Washer Market Size, Share, Growth & Trends by Component (Pump, Electric Motor, Gas Engine, High-pressure Hose), Power Source (Electric, Battery, Gas), Type (Portable, Non-portable), Pressure (<= 103, 103-207, 207-276 bar), Water Operation (HPW, CPW) -Global Forecast to 2032

icon1
USD 4.48
MARKET SIZE, 2032
icon2
CAGR 5.0%
(2026-2032)
icon3
300
REPORT PAGES
icon4
180
MARKET TABLES

PRESSURE WASHER MARKET OVERVIEW

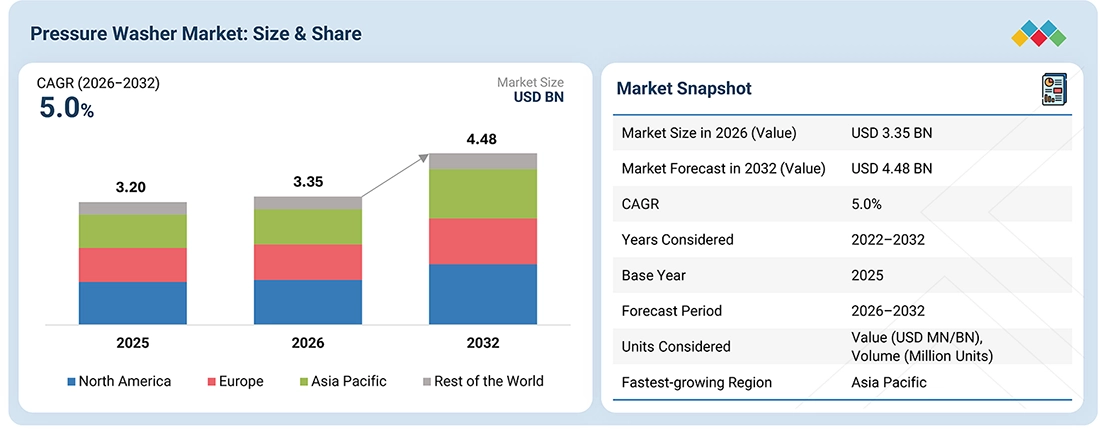
According to Marketsandmarkets, the global pressure washer market size is projected to grow from USD 3.35 billion in 2026 to USD 4.48 billion by 2032, growing at a CAGR of 5.0% from 2026 to 2032. The market expansion is attributed to the growing demand for efficient cleaning solutions across residential, commercial, and industrial applications. Increasing adoption of pressure washers for vehicle cleaning, equipment maintenance, construction, facility management, and outdoor surface cleaning is further driving demand. In addition, rising demand for electric and cordless models, portable equipment, water-efficient cleaning solutions, and advanced pressure washer technologies is supporting market growth across industries.

REPORT SCOPE

REPORT METRIC DETAILS
Market Size in 2026 (Value) USD 3.35 Billion
Market Forecast in 2032 (Value) USD 4.48 Billion
CAGR 5.0%
Years Considered 2022–2032
Base Year 2025
Forecast Period 2026–2032
Units Considered Value (USD Million/Billion), Volume (Million Units)
Report Coverage Revenue Forecast, Company Ranking, Competitive Landscape, Growth Factors, and Trends
Top Companies
  • Alfred Kärcher SE & Co. KG (Germany)
  • Generac Power Systems, Inc. (US)
  • Techtronic Industries Co., Ltd. (China)
  • Stanley Black & Decker, Inc. (US)
  • Nilfisk Group (Denmark)
Growth Drivers
  • Increasing demand for cleaning vehicles, driveways, patios, parking areas, and outdoor surfaces across residential and commercial sectors is driving pressure washer adoption.
  • Growing awareness of home maintenance and outdoor hygiene is encouraging homeowners to adopt pressure washers for efficient cleaning of walls, roofs, gardens, and other exterior surfaces.
  • Increasing use of pressure washers in commercial buildings, manufacturing facilities, warehouses, construction sites, and equipment maintenance is supporting market growth.
  • The need to reduce cleaning time, labor requirements, and water consumption compared with certain conventional cleaning methods is encouraging the adoption of high-pressure cleaning equipment.
  • The growing availability of lightweight, compact, electric, and easy-to-operate pressure washers is improving accessibility for residential users, small businesses, and professional cleaning service providers.
Segments Covered
  • By Component:
    • Water Pump
    • Electric Motor/Gas Engine
    • High-pressure Hose
    • Nozzle
    • Others
  • By Power Source:
    • Electric
    • Gas
  • By Type:
    • Portable
    • Non-portable
  • By Pressure:
    • <103
    • 103–207
    • 207–276
    • and >276 Bars
  • By Water Operation:
    • Hot Water Pressure Washer (HPW)
    • Cold Water Pressure Washer (CPW)
  • By Application:
    • Commercial
    • Residential/DIY
    • Industrial
  • By Sales Channel:
    • Online
    • Offline
Regions Covered North America, Europe, Asia Pacific, Rest of the World

KEY TAKEAWAYS

  • BY REGION
    Asia Pacific is projected to register the highest CAGR of 5.7% during the forecast period, driven by rapid urbanization, increasing industrialization, infrastructure development, and growing adoption of pressure washers across residential, commercial, automotive, construction, and industrial applications.
  • BY COMPONENT
    The electric motor/gas engine segment is estimated to lead the pressure washer market during the forecast period, driven by its essential role in powering pressure washer systems across residential, commercial, and industrial applications.
  • BY APPLICATION
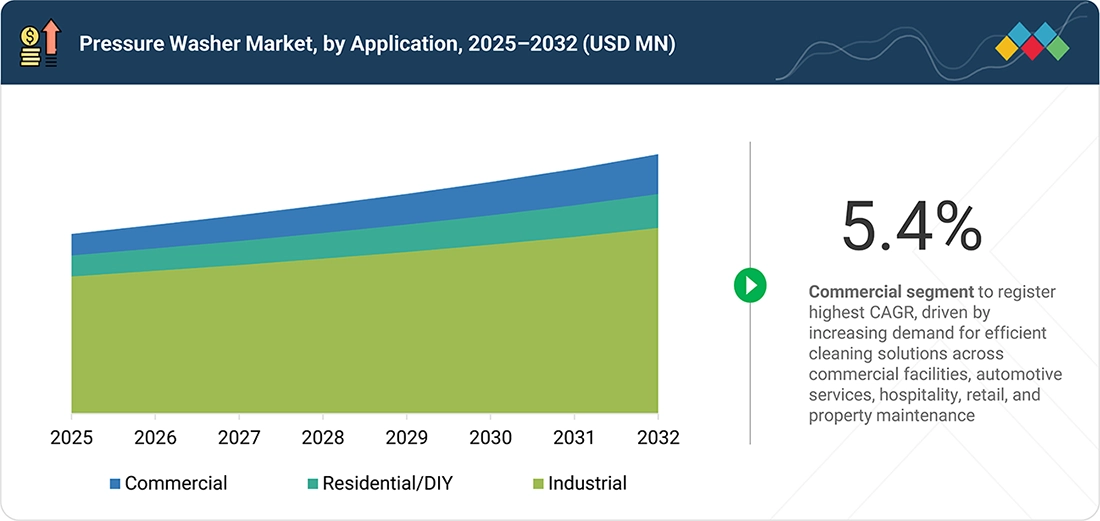
    The commercial segment is projected to register the highest CAGR of 5.4% during the forecast period, driven by increasing demand for efficient cleaning solutions across commercial facilities, automotive services, hospitality, retail, and property maintenance.
  • BY TYPE
    The portable segment is estimated to lead the pressure washer market during the forecast period, driven by increasing demand for flexible and convenient cleaning equipment across residential, commercial, and professional applications.
  • BY POWER SOURCE
    The electric segment is estimated to lead the pressure washer market during the forecast period, supported by increasing adoption across residential, commercial, and light industrial applications.
  • BY PRESSURE
    The 207–276 bar segment is projected to register the highest CAGR of 5.5% during the forecast period, driven by increasing demand for high-performance cleaning equipment across commercial, industrial, automotive, and construction applications.
  • BY WATER OPERATION
    The cold water pressure washer segment is projected to register a higher CAGR of 5.7% during the forecast period, driven by increasing demand for versatile and cost-effective cleaning equipment across residential, commercial, and industrial applications.
  • BY SALES CHANNEL
    The online segment is projected to register a higher CAGR of 5.5% during the forecast period, driven by increasing consumer preference for convenient product discovery, comparison, and purchasing through e-commerce platforms.
  • COMPETITIVE LANDSCAPE - Key Players
    Alfred Kärcher SE & Co. KG, Techtronic Industries Co., Ltd., Generac Power Systems, Inc., Stanley Black & Decker, Inc., and Nilfisk Group are identified as key players in the pressure washer market, supported by broad product portfolios, established geographic presence, and offerings across residential, commercial, professional, and industrial applications.
  • COMPETITIVE LANDSCAPE - Startups/SMEs
    Robert Bosch Power Tools GmbH, Husqvarna Group, Alkota Cleaning Systems, Shop Joe, and Deere & Company, among others, operate in the pressure washer market through portfolios covering electric, gas-powered, portable, professional, and specialized cleaning equipment for diverse applications.

The pressure washer industry is projected to expand steadily during the forecast period, driven by increasing demand for efficient cleaning solutions, growing adoption across residential, commercial, and industrial applications, and rising focus on water-efficient cleaning. The expanding use of pressure washers across automotive, construction, manufacturing, facility maintenance, and outdoor cleaning applications will continue to present new growth prospects. With increasing adoption of electric and cordless technologies, portable equipment, advanced pumps, and smart cleaning solutions, the market is anticipated to grow steadily during the forecast period.

pressure-washer-market Overview

Source: Secondary Research, Interviews with Experts, MarketsandMarkets Analysis

TRENDS & DISRUPTIONS IMPACTING CUSTOMERS' CUSTOMERS

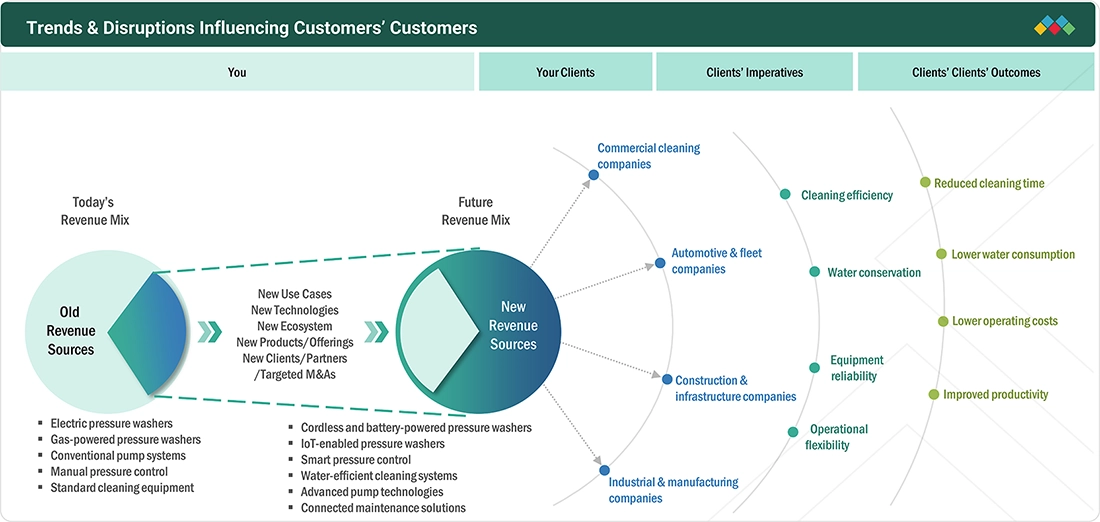
Pressure washer demand is shifting from conventional cleaning equipment toward electric, cordless, portable, water-efficient, and connected pressure washer solutions designed to address evolving cleaning requirements. This shift is being driven by four key buyer groups—commercial cleaning companies, automotive & fleet companies, construction & infrastructure companies, and industrial & manufacturing companies—each responding to specific requirements such as cleaning efficiency, water conservation, equipment reliability, and operational flexibility. These requirements are increasingly influencing equipment selection, including cordless and battery-powered pressure washers, smart pressure control, water-efficient cleaning systems, and advanced pump technologies. Further downstream, the end markets served by these buyers are seeking reduced cleaning time, lower water consumption, lower operating costs, and improved productivity. As cleaning operations require greater efficiency, mobility, and resource optimization, demand for advanced pressure washer solutions is expected to increase.

pressure-washer-market Disruptions

Source: Secondary Research, Interviews with Experts, MarketsandMarkets Analysis

MARKET DYNAMICS

Drivers
Impact
Level
  • Rising demand for outdoor cleaning across residential and commercial sectors
  • Growth in automotive & transportation sector
RESTRAINTS
Impact
Level
  • High initial investment and maintenance costs
  • Water consumption and environmental concerns
OPPORTUNITIES
Impact
Level
  • Integration of smart features and battery-operated designs
  • Urbanization and infrastructure development in emerging economies
CHALLENGES
Impact
Level
  • Competition from traditional and alternative cleaning technologies
  • Technical limitations restricting use of pressure washers in indoor and sensitive environments

Source: Secondary Research, Interviews with Experts, MarketsandMarkets Analysis

Driver: Rising demand for outdoor cleaning across residential and commercial sectors

The growing demand for outdoor cleaning across residential and commercial sectors is significantly driving the pressure washer market. Consumers and businesses are increasingly adopting pressure washers for cleaning vehicles, buildings, driveways, parking areas, equipment, and outdoor surfaces, enabling faster and more effective cleaning. The growing focus on maintaining clean residential and commercial spaces is encouraging the replacement of conventional cleaning methods with high-pressure cleaning equipment. The increasing availability of portable, electric, and user-friendly pressure washers is further supporting adoption across diverse outdoor cleaning applications.

Restraint: High initial investment and maintenance costs

The pressure washer market faces pricing pressure due to the high initial investment and maintenance costs associated with advanced equipment. Professional and industrial pressure washers often require higher upfront expenditure due to their high-performance pumps, motors, specialized components, and additional features. Regular maintenance, replacement of hoses and nozzles, and servicing requirements can further increase the overall cost of ownership. These cost considerations can limit adoption among price-sensitive residential and small commercial users and affect market penetration.

Opportunity: Integration of smart features and battery-operated designs

The integration of smart features and battery-operated designs presents new growth opportunities for pressure washer manufacturers. Connected pressure washers with digital controls, smart pressure adjustment, usage monitoring, and maintenance alerts can improve equipment usability and operational efficiency. Battery-powered models provide greater mobility and flexibility by reducing dependence on power outlets, particularly for outdoor and remote cleaning applications. Advancements in battery technology, compact designs, and cordless operation are expected to create new opportunities across residential, commercial, and professional applications.

Challenge: Competition from traditional and alternative cleaning technologies

Competition from traditional and alternative cleaning technologies presents a challenge to the pressure washer market's growth. Conventional cleaning methods, manual equipment, steam cleaning, and other specialized cleaning technologies continue to serve various residential, commercial, and industrial applications. Users may select these alternatives based on application requirements, cost, operating conditions, or equipment availability. Pressure washer manufacturers, therefore, need to differentiate products through cleaning performance, portability, water efficiency, ease of use, and application-specific features.

PRESSURE WASHER MARKET: COMMERCIAL USE CASES ACROSS INDUSTRIES

COMPANY USE CASE DESCRIPTION BENEFITS
company logo
Kärcher’s eco!Booster is used with K4, K5, and K7 pressure washers for outdoor cleaning applications, providing a wider cleaning area and enhanced cleaning performance. Delivers 50% higher cleaning performance while achieving 50% higher water and energy efficiency compared with the equivalent standard flat-jet nozzle.
company logo
The Premium 190 pressure washer is designed for frequent and larger cleaning tasks, including cleaning large outdoor areas, vehicles, and other demanding surfaces. Provides 190 bar maximum pressure, flexible pressure regulation, mobility through an integrated trolley and large wheels, and cleaning capacity of up to 60 m²/hour.
company logo
Generac’s Speedwash 2900 PSI pressure washer is designed for residential and jobsite cleaning applications, including driveway cleaning and surface preparation before painting. Provides high-pressure cleaning capability for home maintenance and jobsite applications, supporting faster and more effective surface preparation.

Logos and trademarks shown above are the property of their respective owners. Their use here is for informational and illustrative purposes only.

MARKET ECOSYSTEM

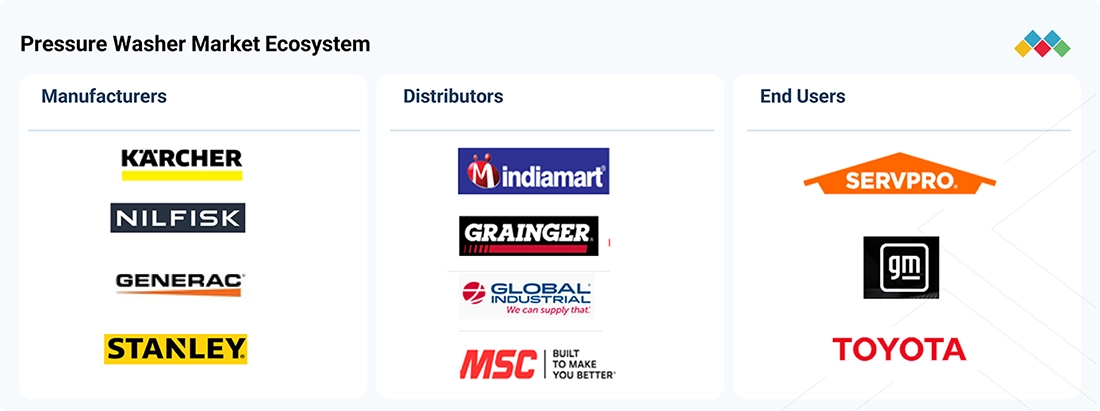
The pressure washer ecosystem comprises several interconnected stakeholders supporting the manufacturing, distribution, sale, and use of pressure washing equipment across diverse applications. Manufacturers develop and supply pressure washers, components, accessories, and related cleaning solutions, while distributors and retailers facilitate product availability across residential, commercial, and industrial markets. End users adopt pressure washers for applications such as vehicle cleaning, equipment maintenance, facility cleaning, construction, and outdoor surface cleaning. The ecosystem is supported by product innovation, distribution networks, service providers, and technology providers, driving demand for efficient, portable, electric, cordless, and application-specific pressure washing solutions.

pressure-washer-market Ecosystem

Logos and trademarks shown above are the property of their respective owners. Their use here is for informational and illustrative purposes only.

MARKET SEGMENTS

pressure-washer-market Segments

Source: Secondary Research, Interviews with Experts, MarketsandMarkets Analysis

Pressure Washer Market, By Application

The commercial segment is projected to register the highest CAGR during the forecast period, driven by increasing demand for efficient cleaning solutions across commercial facilities, automotive services, hospitality, retail, and property maintenance. Growing requirements for frequent cleaning of vehicles, buildings, equipment, parking areas, and outdoor surfaces are further supporting the adoption of pressure washers in commercial applications.

Pressure Washer Market, By Component

The electric motor/gas engine segment is expected to account for the largest market share during the forecast period, driven by its essential role in powering pressure washer systems across residential, commercial, and industrial applications. Continued demand for reliable and high-performance cleaning equipment is supporting the adoption of electric motors and gas engines. Advancements in motor efficiency, power output, durability, and compact designs are further supporting the segment's growth.

Pressure Washer Market, By Type

The portable segment is expected to account for the largest market share during the forecast period, driven by increasing demand for flexible and convenient cleaning equipment across residential, commercial, and professional applications. Portable pressure washers are widely used for vehicle cleaning, outdoor maintenance, building cleaning, and equipment maintenance due to their ease of movement. The growing availability of compact, lightweight, electric, and battery-powered models is further supporting segment adoption.

Pressure Washer Market, By Power Source

The electric segment is expected to account for the largest market share during the forecast period, supported by increasing adoption across residential, commercial, and light industrial applications. Electric pressure washers offer ease of operation, lower maintenance requirements, reduced noise, and convenient operation for a wide range of cleaning tasks. Growing availability of advanced electric and cordless models is further supporting demand for electric-powered pressure washers.

Pressure Washer Market, By Pressure

The 207–276 bar segment is expected to register the highest CAGR during the forecast period, driven by increasing demand for high-performance cleaning equipment across commercial, industrial, automotive, and construction applications. Pressure washers in this range provide higher cleaning power for vehicles, machinery, equipment, and heavy-duty surfaces. Growing adoption of professional cleaning services and increasing maintenance requirements are further supporting demand for pressure washers in this pressure range.

Pressure Washer Market, By Water Operation

The cold water pressure washer segment is expected to register a higher CAGR during the forecast period, driven by increasing demand for versatile and cost-effective cleaning equipment across residential, commercial, and industrial applications. Cold water pressure washers are widely used for vehicle cleaning, building maintenance, equipment cleaning, and outdoor surface cleaning. Growing adoption for routine cleaning and maintenance activities is further supporting demand for cold water models.

Pressure Washer Market, By Sales Channel

The online segment is expected to register a higher CAGR during the forecast period, driven by increasing consumer preference for convenient product discovery, comparison, and purchasing through e-commerce platforms. Online channels provide access to a broad range of pressure washers, accessories, and replacement components across multiple brands. Growing e-commerce penetration, digital product information, customer reviews, and home delivery services are further supporting online sales.

REGION

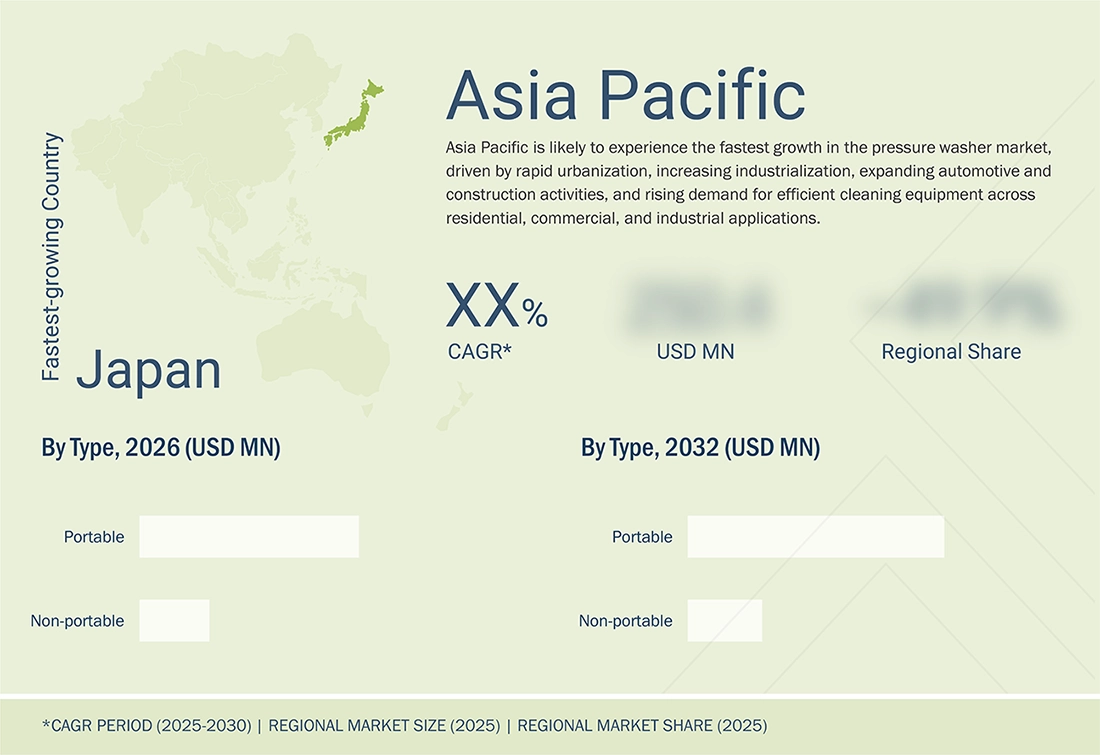
Asia Pacific to be fastest-growing region in global pressure washer market during forecast period

Asia Pacific is likely to be the fastest-growing regional market for pressure washers, driven by rapid urbanization, increasing industrialization, expanding automotive and construction activities, and rising demand for efficient cleaning equipment. Countries such as China, India, Japan, and South Korea are witnessing increasing adoption of pressure washers across residential, commercial, automotive, and industrial applications.

pressure-washer-market Region

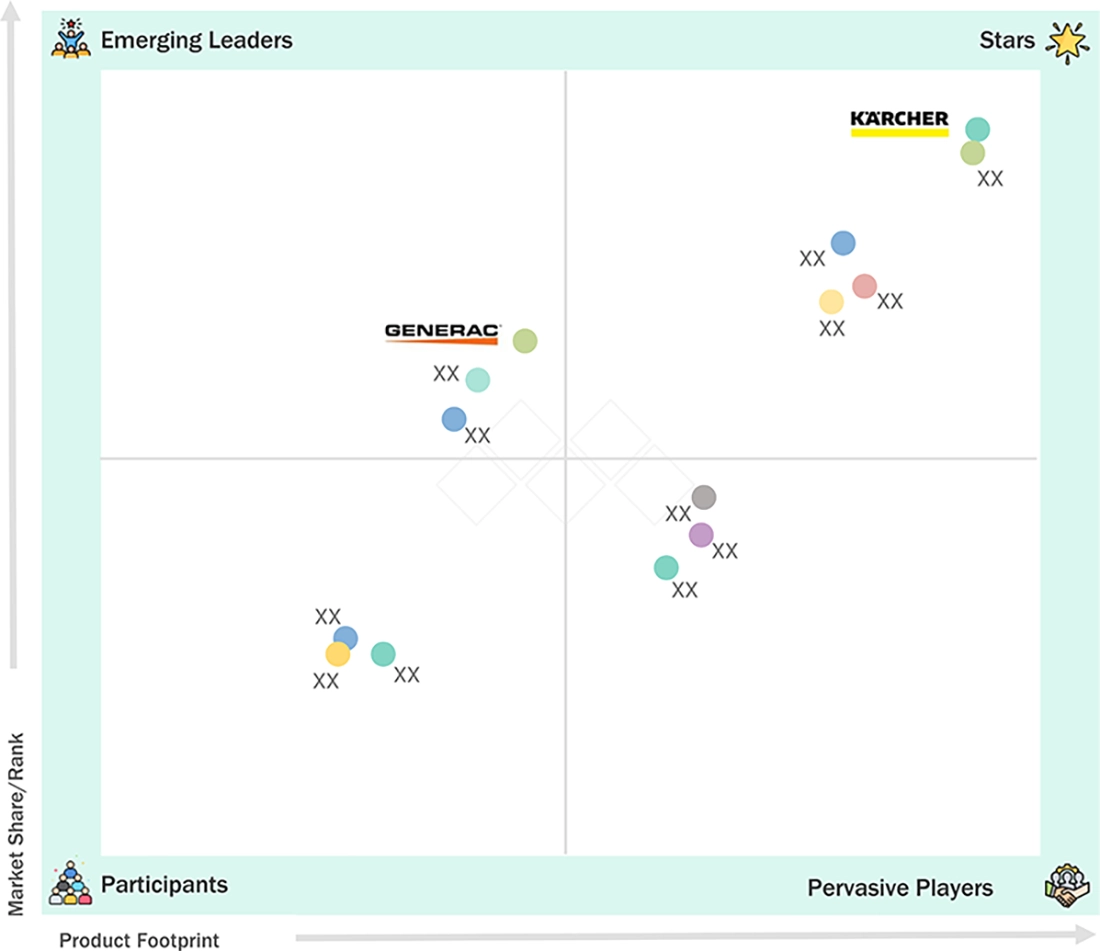
PRESSURE WASHER MARKET: COMPANY EVALUATION MATRIX

Alfred Kärcher SE & Co. KG (Star) maintains a strong position in the pressure washer market with a broad portfolio of pressure washing solutions covering residential, commercial, professional, and industrial applications. Its extensive product range supports applications such as vehicle cleaning, outdoor surface maintenance, equipment cleaning, and facility maintenance, while continued investments in product innovation, cordless technologies, and water-efficient cleaning solutions strengthen its market presence. Generac Power Systems, Inc. (Emerging Leader) is expanding its position by offering a diverse range of pressure washers designed for residential, commercial, and professional applications, with products focused on high cleaning performance, portability, durability, and ease of use.

pressure-washer-market Evaluation Metrics

Source: Secondary Research, Interviews with Experts, MarketsandMarkets Analysis

KEY MARKET PLAYERS - TOP PRESSURE WASHER COMAPNIES

WHAT IS IN IT FOR YOU: PRESSURE WASHER MARKET REPORT CONTENT GUIDE

pressure-washer-market Content Guide

DELIVERED CUSTOMIZATIONS

We have successfully delivered the following deep-dive customizations:

CLIENT REQUEST CUSTOMIZATION DELIVERED VALUE ADDS
Cleaning Equipment Company
  • Benchmarking pressure washer requirements across residential, commercial, automotive, construction, and industrial applications
  • Analysis of product types, power sources, pressure ranges, and technology adoption
  • Identify high-growth pressure washer applications and product opportunities
  • Support product portfolio expansion and technology development
Industrial & Commercial Company
  • Assessment of pressure washer requirements for equipment maintenance, facility cleaning, vehicle cleaning, and heavy-duty applications
  • Case analysis of pressure washer adoption across industrial and commercial end users
  • Identify application-specific equipment requirements and market opportunities
  • Support operational cleaning efficiency and equipment selection

RECENT DEVELOPMENTS

  • March 2026 : Nilfisk introduced the new Classic 140 pressure washer as part of its refreshed 2026 consumer product range. The model features compact storage, a durable metal pump, an Ultraflex hose, and improved manoeuvrability for outdoor cleaning applications.
  • January 2026 : Kärcher introduced its new Comfort range of premium pressure washers, covering the K 4 to K 7 classes. The range features app connectivity, trigger-gun controls, a 4-in-1 Multi-Jet lance, the 2Way!Wash detergent concept, and enhanced ergonomic handling.


Table of Contents

checkmarkExclusive indicates content/data unique to MarketsandMarkets and not available with any competitors.

TITLE
PAGE NO
1
INTRODUCTION


26
2
EXECUTIVE SUMMARY


31
3
PREMIUM INSIGHTS


36
4
MARKET OVERVIEW
Explore growth catalysts and challenges in the evolving pressure washer market landscape.


39
 
4.1
INTRODUCTION


4.2
MARKET DYNAMICS


4.2.1
DRIVERS


4.2.1.1
RISING DEMAND FOR OUTDOOR CLEANING ACROSS RESIDENTIAL AND COMMERCIAL SECTORS


4.2.1.2
GROWTH IN AUTOMOTIVE & TRANSPORTATION SECTOR


4.2.1.3
STRINGENT GOVERNMENT REGULATIONS ON CLEANLINESS AND SANITATION


4.2.2
RESTRAINTS


4.2.2.1
HIGH INITIAL INVESTMENT AND MAINTENANCE COSTS


4.2.2.2
WATER CONSUMPTION AND ENVIRONMENTAL CONCERNS


4.2.3
OPPORTUNITIES


4.2.3.1
INTEGRATION OF SMART FEATURES AND BATTERY-OPERATED DESIGNS


4.2.3.2
URBANIZATION AND INFRASTRUCTURE DEVELOPMENT IN EMERGING ECONOMIES


4.2.4
CHALLENGES


4.2.4.1
COMPETITION FROM TRADITIONAL AND ALTERNATIVE CLEANING TECHNOLOGIES


4.2.4.2
TECHNICAL LIMITATIONS RESTRICTING USE OF PRESSURE WASHERS IN INDOOR AND SENSITIVE ENVIRONMENTS


4.3
INTERCONNECTED MARKETS AND CROSS-SECTOR OPPORTUNITIES


4.4
STRATEGIC MOVES BY TIER 1/2/3 PLAYERS


5
INDUSTRY TRENDS
Navigate industry dynamics with insights on competitive forces and evolving global pressure washer trends.


47
 
5.1
PORTER’S FIVE FORCES ANALYSIS


5.1.1
THREAT OF NEW ENTRANTS


5.1.2
THREAT OF SUBSTITUTES


5.1.3
BARGAINING POWER OF SUPPLIERS


5.1.4
BARGAINING POWER OF BUYERS


5.1.5
INTENSITY OF COMPETITIVE RIVALRY


5.2
MACROECONOMIC OUTLOOK


5.2.1
INTRODUCTION


5.2.2
GDP TRENDS AND FORECAST


5.2.3
TRENDS IN GLOBAL COMMERCIAL SECTOR


5.2.4
TRENDS IN GLOBAL RESIDENTIAL/DIY SECTOR


5.2.5
TRENDS IN GLOBAL INDUSTRIAL SECTOR


5.3
VALUE CHAIN ANALYSIS


5.4
ECOSYSTEM ANALYSIS


5.5
PRICING ANALYSIS


5.5.1
PRICING RANGE OF PRESSURE WASHERS OFFERED BY KEY PLAYERS, BY POWER SOURCE, 2025


5.5.2
AVERAGE SELLING PRICE TREND OF PRESSURE WASHERS, BY REGION, 2022–2025


5.6
TRADE ANALYSIS


5.6.1
IMPORT SCENARIO (HS CODE 842430)


5.6.2
EXPORT SCENARIO (HS CODE 842430)


5.7
KEY CONFERENCES AND EVENTS, 2026–2027


5.8
TRENDS/DISRUPTIONS IMPACTING CUSTOMER BUSINESS


5.9
INVESTMENT AND FUNDING SCENARIO


5.10
CASE STUDY ANALYSIS


5.10.1
LOGISTICS FLEET FACILITY INSTALLS KÄRCHER HOT WATER PRESSURE SYSTEM TO OPTIMIZE FLEET WASHING AND DEGREASING


5.10.2
FOOD PROCESSING PLANT DEPLOYS NILFISK STATIONARY HIGH PRESSURE CLEANING SYSTEM TO IMPROVE SANITATION EFFICIENCY


5.10.3
COMMERCIAL CONSTRUCTION CONTRACTOR INTEGRATES SIMPSON GAS PRESSURE WASHERS FOR SURFACE RESTORATION


5.11
IMPACT OF US TARIFFS – PRESSURE WASHER MARKET


5.11.1
INTRODUCTION


5.11.2
KEY TARIFF RATES


5.11.3
PRICE IMPACT ANALYSIS


5.11.4
IMPACT ON COUNTRIES/REGIONS


5.11.4.1
US


5.11.4.2
EUROPE


5.11.4.3
ASIA PACIFIC


5.11.5
IMPACT ON APPLICATIONS


6
TECHNOLOGICAL ADVANCEMENTS, AI-DRIVEN IMPACT, PATENTS, INNOVATIONS, AND FUTURE APPLICATIONS
AI-driven innovations revolutionize pressure washers with predictive maintenance and adaptive control technologies.


66
 
6.1
TECHNOLOGY ANALYSIS


6.1.1
KEY TECHNOLOGIES


6.1.1.1
SMART AND CONNECTED OUTDOOR POWER EQUIPMENT


6.1.1.2
40V MAX AND 80V MAX LITHIUM-ION BATTERIES


6.1.2
COMPLEMENTARY TECHNOLOGIES


6.1.2.1
HYDROSTATIC TRANSMISSION SYSTEMS


6.1.3
ADJACENT TECHNOLOGIES


6.1.3.1
IOT SENSORS


6.1.3.2
ARTIFICIAL INTELLIGENCE


6.1.3.3
PREDICTIVE MAINTENANCE


6.2
TECHNOLOGY/PRODUCT ROADMAP


6.3
PATENT ANALYSIS


6.4
IMPACT OF AI/GEN AI ON PRESSURE WASHER MARKET


6.4.1
TOP USE CASES AND MARKET POTENTIAL


6.4.1.1
ADAPTIVE PRESSURE CONTROL VIA MACHINE LEARNING (KÄRCHER SMART CONTROL ECOSYSTEM)


6.4.1.2
CLOUD-BASED TELEMETRY AND FLEET OPTIMIZATION FOR COMMERCIAL FACILITIES (NILFISK CONNECTED FLEET SOLUTIONS)


6.4.1.3
AUTONOMOUS EXTERIOR SURFACE CLEANING ROBOTICS (LUCID BOTS GROUND AND AERIAL AUTOMATION)


6.4.2
BEST PRACTICES FOLLOWED BY OEMS IN PRESSURE WASHER MARKET


6.4.3
CASE STUDIES RELATED TO AI/GEN AI IMPLEMENTATION IN PRESSURE WASHER MARKET


6.4.4
INTERCONNECTED ECOSYSTEM AND IMPACT ON MARKET PLAYERS


6.4.5
CLIENTS' READINESS TO ADOPT AI/GEN AI-INTEGRATED PRESSURE WASHERS


6.5
SUCCESS STORIES AND REAL WORLD APPLICATIONS


7
REGULATORY LANDSCAPE
Navigate complex global regulations with insights into key regional compliance standards and bodies.


75
 
7.1
REGIONAL REGULATIONS AND COMPLIANCE


7.1.1
REGULATORY BODIES, GOVERNMENT AGENCIES, AND OTHER ORGANIZATIONS


7.1.2
STANDARDS


7.1.3
REGULATIONS


8
CUSTOMER LANDSCAPE AND BUYER BEHAVIOR
Unlock hidden profit by understanding stakeholder influence and unmet needs in buyer decisions.


80
 
8.1
INTRODUCTION


8.2
DECISION-MAKING PROCESS


8.3
KEY STAKEHOLDERS INVOLVED IN BUYING PROCESS AND EVALUATION CRITERIA


8.3.1
KEY STAKEHOLDERS IN BUYING PROCESS


8.3.2
BUYING CRITERIA


8.4
ADOPTION BARRIERS AND INTERNAL CHALLENGES


8.5
UNMET NEEDS OF VARIOUS APPLICATIONS


8.6
MARKET PROFITABILITY


8.6.1
REVENUE POTENTIAL


8.6.2
COST DYNAMICS


8.6.3
MARGIN OPPORTUNITIES, BY APPLICATION


9
PRESSURE WASHER MARKET, BY COMPONENT
Market Size & Growth Rate Forecast Analysis to 2032 in USD Million | 12 Data Tables


88
 
9.1
INTRODUCTION


9.2
WATER PUMP


9.2.1
STRONG FOCUS ON ENHANCING DURABILITY AND REDUCING DOWNTIME TO FOSTER SEGMENTAL GROWTH


9.3
ELECTRIC MOTOR/GAS ENGINE


9.3.1
INCREASED INNOVATION AND ENERGY EFFICIENCY TO DRIVE MARKET


9.4
HIGH-PRESSURE HOSE


9.4.1
HIGH AWARENESS OF SAFETY STANDARDS AND REGULATORY COMPLIANCE TO BOOST SEGMENTAL GROWTH


9.5
NOZZLE


9.5.1
STRONG FOCUS ON ERGONOMIC DESIGN AND SAFETY FEATURES TO AUGMENT SEGMENTAL GROWTH


9.6
OTHER COMPONENTS


10
PRESSURE WASHER MARKET, BY TYPE
Market Size & Growth Rate Forecast Analysis to 2032 in USD Million and Units | 12 Data Tables


95
 
10.1
INTRODUCTION


10.2
PORTABLE


10.2.1
TECHNICAL ADVANCEMENTS AND DIVERSE APPLICATIONS TO BOOST SEGMENTAL GROWTH


10.3
NON-PORTABLE


10.3.1
GROWING NEED FOR CLEANING HEAVY-DUTY OBJECTS TO SPUR DEMAND


11
PRESSURE WASHER MARKET, BY POWER SOURCE
Market Size & Growth Rate Forecast Analysis to 2032 in USD Million and Units | 14 Data Tables


101
 
11.1
INTRODUCTION


11.2
ELECTRIC


11.2.1
CORDED


11.2.1.1
CONSISTENT POWER SUPPLY AND EASE OF USE TO CONTRIBUTE TO SEGMENTAL GROWTH


11.2.2
CORDLESS (BATTERY)


11.2.2.1
INCREASING PORTABILITY AND ADVANCEMENTS IN BATTERY TECHNOLOGY TO FUEL SEGMENTAL GROWTH


11.3
GAS


11.3.1
HIGH POWER OUTPUT AND RUGGED PERFORMANCE IN HEAVY-DUTY APPLICATIONS TO DRIVE MARKET


12
PRESSURE WASHER MARKET, BY WATER OPERATION
Market Size & Growth Rate Forecast Analysis to 2032 in USD Million | 6 Data Tables


108
 
12.1
INTRODUCTION


12.2
HOT WATER PRESSURE WASHER (HPW)


12.2.1
SUPERIOR PERFORMANCE COMPARED WITH COLD WATER ALTERNATIVES TO SPUR DEMAND


12.3
COLD WATER PRESSURE WASHER (CPW)


12.3.1
RISING ADOPTION IN RESIDENTIAL APPLICATIONS TO ACCELERATE SEGMENTAL GROWTH


13
PRESSURE WASHER MARKET, BY PRESSURE
Market Size & Growth Rate Forecast Analysis to 2032 in USD Million | 10 Data Tables


112
 
13.1
INTRODUCTION


13.2
<103 BAR


13.2.1
RISING POPULARITY OF LIGHT-DUTY AND CONSUMER-FRIENDLY MODELS TO FOSTER SEGMENTAL GROWTH


13.3
103–207 BAR


13.3.1
EXPANDING VERSATILITY FOR MEDIUM-DUTY TASKS TO SPUR DEMAND


13.4
>207–276 BAR


13.4.1
INCREASED ADOPTION IN HEAVY-DUTY COMMERCIAL CLEANING TASKS TO AUGMENT SEGMENTAL GROWTH


13.5
>276 BAR


13.5.1
RISING NEED FOR INDUSTRIAL-GRADE, HIGH-PRESSURE SOLUTIONS IN CRITICAL ENVIRONMENTS TO BOLSTER SEGMENTAL GROWTH


14
PRESSURE WASHER MARKET, BY SALES CHANNEL
Market Size & Growth Rate Forecast Analysis to 2032 in USD Million | 2 Data Tables


118
 
14.1
INTRODUCTION


14.2
ONLINE


14.2.1
RISING INTERNET PENETRATION TO AUGMENT SEGMENTAL GROWTH


14.3
OFFLINE


14.3.1
AFTER-SALES SERVICE FACILITY OF OFFLINE SALES TO BOLSTER SEGMENTAL GROWTH


15
PRESSURE WASHER MARKET, BY APPLICATION
Market Size & Growth Rate Forecast Analysis to 2032 in USD Million | 20 Data Tables


121
 
15.1
INTRODUCTION


15.2
COMMERCIAL


15.2.1
MOUNTING DEPLOYMENT OF INTERNET OF THINGS AND ARTIFICIAL INTELLIGENCE TECHNOLOGIES TO ACCELERATE SEGMENTAL GROWTH


15.2.2
CONSTRUCTION


15.2.3
HOTELS


15.2.4
AGRICULTURE


15.2.5
WATER TREATMENT PLANTS


15.2.6
RETAIL


15.2.7
VEHICLE CLEANING STATIONS


15.3
RESIDENTIAL/DIY


15.3.1
HIGH EMPHASIS ON OUTDOOR LIVING SPACES AND HOME AESTHETICS TO CONTRIBUTE TO SEGMENTAL GROWTH


15.3.2
GARDENS


15.3.3
POOLS


15.3.4
VEHICLES


15.3.5
HOUSES


15.4
INDUSTRIAL


15.4.1
GROWING USE FOR CLEANING MACHINERY TO DRIVE MARKET


16
PRESSURE WASHER MARKET, BY REGION
Comprehensive coverage of 9 Regions with country-level deep-dive of 17 Countries | 84 Data Tables.


132
 
16.1
INTRODUCTION


16.2
NORTH AMERICA


16.2.1
US


16.2.1.1
SIGNIFICANT PRESENCE OF LEADING MANUFACTURERS TO DRIVE MARKET


16.2.2
CANADA


16.2.2.1
HIGH ADOPTION OF PRESSURE WASHERS IN FOOD PROCESSING INDUSTRY TO CREATE MARKET GROWTH OPPORTUNITIES


16.2.3
MEXICO


16.2.3.1
INCREASED USE OF PRESSURE WASHERS IN CONSTRUCTION PROJECTS TO SUPPORT MARKET GROWTH


16.3
EUROPE


16.3.1
GERMANY


16.3.1.1
BOOMING AUTOMOTIVE INDUSTRY TO CONTRIBUTE TO MARKET GROWTH


16.3.2
UK


16.3.2.1
RISING SUSTAINABILITY FOCUS AND FACILITY MAINTENANCE NEEDS TO DRIVE MARKET


16.3.3
FRANCE


16.3.3.1
INDUSTRIAL MODERNIZATION AND ECO-CONSCIOUS CLEANING SOLUTIONS TO EXPEDITE MARKET GROWTH


16.3.4
ITALY


16.3.4.1
RISING DEMAND FOR EFFICIENT CLEANING SOLUTIONS IN INDUSTRIAL AND RESIDENTIAL SECTORS TO DRIVE MARKET


16.3.5
SPAIN


16.3.5.1
RISING CONSTRUCTION ACTIVITIES AND ECO-CONSCIOUS CONSUMER BEHAVIOR TO BOOST MARKET GROWTH


16.3.6
POLAND


16.3.6.1
THRIVING AUTOMOTIVE AND CONSTRUCTION INDUSTRIES TO DRIVE MARKET


16.3.7
NORDICS


16.3.7.1
URBANIZATION, SUSTAINABILITY, AND INDUSTRIAL DEMAND TO DRIVE MARKET


16.3.8
REST OF EUROPE


16.4
ASIA PACIFIC


16.4.1
CHINA


16.4.1.1
RAPID INDUSTRIAL GROWTH AND URBANIZATION TO ACCELERATE MARKET GROWTH


16.4.2
JAPAN


16.4.2.1
EMPHASIS ON EFFICIENCY AND INNOVATION TO DRIVE MARKET


16.4.3
SOUTH KOREA


16.4.3.1
INCREASING USE IN SHIPBUILDING AND HOTELS TO ACCELERATE MARKET GROWTH


16.4.4
INDIA


16.4.4.1
RISE IN INFRASTRUCTURE DEVELOPMENT TO BOLSTER MARKET GROWTH


16.4.5
AUSTRALIA


16.4.5.1
FOCUS ON RESIDENTIAL AND COMMERCIAL OUTDOOR CLEANING TO DRIVE MARKET


16.4.6
INDONESIA


16.4.6.1
RISING URBAN POPULATION AND INDUSTRIAL ACTIVITY TO CONTRIBUTE TO MARKET GROWTH


16.4.7
MALAYSIA


16.4.7.1
MOUNTING DEMAND FOR EFFICIENT AND EFFECTIVE CLEANING SOLUTIONS TO AUGMENT MARKET GROWTH


16.4.8
THAILAND


16.4.8.1
RISING TOURISM AND HOSPITALITY INDUSTRIES TO FACILITATE MARKET GROWTH


16.4.9
VIETNAM


16.4.9.1
RAPID INDUSTRIALIZATION TO ACCELERATE MARKET GROWTH


16.4.10
REST OF ASIA PACIFIC


16.5
ROW


16.5.1
MIDDLE EAST


16.5.1.1
INCREASING EMPHASIS ON MAINTAINING CLEANLINESS AND HYGIENE ACROSS RESIDENTIAL, COMMERCIAL, AND INDUSTRIAL SECTORS TO DRIVE MARKET


16.5.1.2
GCC


16.5.1.3
REST OF MIDDLE EAST


16.5.2
SOUTH AMERICA


16.5.2.1
POTENTIAL AGRICULTURAL DEVELOPMENT TO DRIVE MARKET


16.5.3
AFRICA


16.5.3.1
BOOMING CONSTRUCTION SECTOR TO BOLSTER MARKET GROWTH


17
COMPETITIVE LANDSCAPE
Discover strategic expansions and key players shaping the competitive landscape through 2026.


168
 
17.1
OVERVIEW


17.2
KEY PLAYER COMPETITIVE STRATEGIES/RIGHT TO WIN, 2023–2026


17.2.1
PRODUCT PORTFOLIO EXPANSION


17.2.2
REGIONAL FOOTPRINT EXPANSION


17.2.3
SOLUTION OFFERING EXPANSION


17.2.4
ORGANIC/INORGANIC STRATEGIES


17.3
REVENUE ANALYSIS, 2021–2025


17.4
MARKET SHARE ANALYSIS, 2025


17.5
COMPANY VALUATION AND FINANCIAL METRICS


17.6
BRAND COMPARISON


17.6.1
ALFRED KÄRCHER SE & CO. KG (GERMANY)


17.6.2
GENERAC POWER SYSTEMS, INC. (US)


17.6.3
TECHTRONIC INDUSTRIES CO. LTD. (TTI) (HONG KONG)


17.6.4
STANLEY BLACK & DECKER, INC. (US)


17.6.5
NILFISK GROUP (DENMARK)


17.7
COMPANY EVALUATION MATRIX: KEY PLAYERS, 2025


17.7.1
STARS


17.7.2
EMERGING LEADERS


17.7.3
PERVASIVE PLAYERS


17.7.4
PARTICIPANTS


17.7.5
COMPANY FOOTPRINT: KEY PLAYERS, 2025


17.7.5.1
COMPANY FOOTPRINT


17.7.5.2
REGION FOOTPRINT


17.7.5.3
TYPE FOOTPRINT


17.7.5.4
POWER SOURCE FOOTPRINT


17.7.5.5
WATER OPERATION FOOTPRINT


17.7.5.6
APPLICATION FOOTPRINT


17.8
COMPANY EVALUATION MATRIX: STARTUPS/SMES, 2025


17.8.1
PROGRESSIVE COMPANIES


17.8.2
RESPONSIVE COMPANIES


17.8.3
DYNAMIC COMPANIES


17.8.4
STARTING BLOCKS


17.8.5
COMPETITIVE BENCHMARKING: STARTUPS/SMES, 2025


17.8.5.1
DETAILED LIST OF KEY STARTUPS/SMES


17.8.5.2
COMPETITIVE BENCHMARKING OF KEY STARTUPS/SMES


17.9
COMPETITIVE SCENARIO


17.9.1
PRODUCT LAUNCHES


17.9.1.1
OTHER DEVELOPMENTS


18
COMPANY PROFILES
In-depth Company Profiles of Leading Market Players with detailed Business Overview, Product and Service Portfolio, Recent Developments, and Unique Analyst Perspective (MnM View)


188
 
18.1
KEY PLAYERS


18.1.1
ALFRED KÄRCHER SE & CO. KG


18.1.1.1
BUSINESS OVERVIEW


18.1.1.2
PRODUCTS/SOLUTIONS/SERVICES OFFERED


18.1.1.3
RECENT DEVELOPMENTS


18.1.1.3.1
PRODUCT LAUNCHES


18.1.1.4
MNM VIEW


18.1.1.4.1
KEY STRENGTHS/RIGHT TO WIN


18.1.1.4.2
STRATEGIC CHOICES


18.1.1.4.3
WEAKNESSES/COMPETITIVE THREATS


18.1.2
GENERAC POWER SYSTEMS, INC.


18.1.3
TECHTRONIC INDUSTRIES CO. LTD.


18.1.4
STANLEY BLACK & DECKER, INC.


18.1.5
NILFISK GROUP


18.1.6
ALKOTA CLEANING SYSTEMS INC.


18.1.7
ANNOVI REVERBERI SPA


18.1.8
MI-T-M CORPORATION


18.1.9
FNA GROUP


18.1.10
SHOP JOE


18.1.11
DEERE & COMPANY


18.1.12
ROBERT BOSCH POWER TOOLS GMBH


18.1.13
HUSQVARNA GROUP


18.1.14
BRIGGS & STRATTON


18.1.15
IP CLEANING SRL


18.2
OTHER PLAYERS


18.2.1
ANLU


18.2.2
STIHL INCORPORATED


18.2.3
EMAK S.P.A


18.2.4
SNAP-ON INCORPORATED


18.2.5
WEN PRODUCTS


18.2.6
BE POWER EQUIPMENT


18.2.7
KOKI HOLDINGS CO., LTD


18.2.8
VORTEX INDUSTRIES INC.


18.2.9
TAIZHOU BISON MACHINERY CO., LTD


18.2.10
KYNKO INDUSTRIAL LIMITED


19
RESEARCH METHODOLOGY


229
 
19.1
RESEARCH DATA


19.1.1
SECONDARY & PRIMARY RESEARCH


19.1.2
SECONDARY DATA


19.1.2.1
LIST OF MAJOR SECONDARY SOURCES


19.1.2.2
KEY DATA FROM SECONDARY SOURCES


19.1.3
PRIMARY DATA


19.1.3.1
LIST OF PRIMARY INTERVIEW PARTICIPANTS


19.1.3.2
KEY PRIMARY INTERVIEW PARTICIPANTS


19.1.3.3
BREAKDOWN OF PRIMARIES


19.1.3.4
KEY DATA FROM PRIMARY SOURCES


19.1.3.5
KEY INDUSTRY INSIGHTS


19.2
MARKET SIZE ESTIMATION METHODOLOGY


19.2.1
BOTTOM-UP APPROACH


19.2.1.1
APPROACH FOR ARRIVING AT MARKET SHARE BY BOTTOM-UP ANALYSIS (DEMAND SIDE)


19.2.2
TOP-DOWN APPROACH


19.2.2.1
APPROACH FOR CAPTURING MARKET SHARE BY TOP-DOWN ANALYSIS (SUPPLY SIDE)


19.3
DATA TRIANGULATION


19.4
RESEARCH ASSUMPTIONS


19.5
RESEARCH LIMITATIONS


19.6
RISK ANALYSIS


20
APPENDIX


239
 
20.1
DISCUSSION GUIDE


20.2
KNOWLEDGESTORE: MARKETSANDMARKETS’ SUBSCRIPTION PORTAL


20.3
CUSTOMIZATION OPTIONS


20.4
RELATED REPORTS


20.5
AUTHOR DETAILS


LIST OF TABLES


TABLE 1
PRESSURE WASHER MARKET: SUMMARY OF CHANGES


TABLE 2
INTERCONNECTED MARKETS AND CROSS-SECTOR OPPORTUNITIES RELATED TO PRESSURE WASHERS


TABLE 3
STRATEGIC FOCUS OF MAJOR COMPANIES IN PRESSURE WASHER MARKET


TABLE 4
IMPACT OF PORTER’S FIVE FORCES


TABLE 5
GDP GROWTH RATES, BY COUNTRY, 2021–2030 (%)


TABLE 6
ROLE OF COMPANIES IN PRESSURE WASHER ECOSYSTEM


TABLE 7
PRICING RANGE OF PRESSURE WASHERS OFFERED BY KEY PLAYERS, BY POWER SOURCE, 2025 (USD)


TABLE 8
AVERAGE SELLING PRICE TREND OF PRESSURE WASHERS, BY REGION, 2022–2025 (USD)


TABLE 9
IMPORT DATA FOR HS CODE 842430-COMPLIANT PRODUCTS, BY COUNTRY, 2021–2025 (USD MILLION)


TABLE 10
EXPORT DATA FOR HS CODE 842430-COMPLIANT PRODUCTS, BY COUNTRY, 2021–2025 (USD MILLION)


TABLE 11
LIST OF KEY CONFERENCES AND EVENTS, 2026–2027


TABLE 12
KÄRCHER INDUSTRIAL HOT WATER PRESSURE SYSTEM INSTALLED TO OPTIMIZE VEHICLE DEGREASING PERFORMANCE AND WATER RECYCLING


TABLE 13
NILFISK INDUSTRIAL MULTI PUMP SYSTEM INSTALLED TO OPTIMIZE CONVEYOR SANITATION AND CHEMICAL CONSUMPTION


TABLE 14
SIMPSON HEAVY DUTY INDUSTRIAL PRESSURE WASHERS DEPLOYED TO ENHANCE MASONRY CLEANING AND COATING REMOVAL


TABLE 15
US-ADJUSTED RECIPROCAL TARIFF RATES, 2025 (USD BILLION)


TABLE 16
LIST OF KEY PATENTS, 2017–2026


TABLE 17
BEST PRACTICES FOLLOWED BY COMPANIES IN PRESSURE WASHER MARKET


TABLE 18
CASE STUDIES RELATED TO AI/GEN AI IMPLEMENTATION


TABLE 19
INTERCONNECTED ECOSYSTEM AND IMPACT ON PRESSURE WASHER MARKET PLAYERS


TABLE 20
NORTH AMERICA: REGULATORY BODIES, GOVERNMENT AGENCIES, AND OTHER ORGANIZATIONS


TABLE 21
EUROPE: REGULATORY BODIES, GOVERNMENT AGENCIES, AND OTHER ORGANIZATIONS


TABLE 22
ASIA PACIFIC: REGULATORY BODIES, GOVERNMENT AGENCIES, AND OTHER ORGANIZATIONS


TABLE 23
ROW: REGULATORY BODIES, GOVERNMENT AGENCIES, AND OTHER ORGANIZATIONS


TABLE 24
INFLUENCE OF STAKEHOLDERS ON BUYING PROCESS, BY APPLICATION (%)


TABLE 25
BUYING CRITERIA, BY APPLICATION


TABLE 26
PRESSURE WASHER ADOPTION BARRIERS AND INTERNAL CHALLENGES


TABLE 27
UNMET NEEDS IN PRESSURE WASHER MARKET, BY APPLICATION


TABLE 28
PRESSURE WASHER MARKET, BY COMPONENT, 2022–2025 (USD MILLION)


TABLE 29
PRESSURE WASHER MARKET, BY COMPONENT, 2026–2032 (USD MILLION)


TABLE 30
WATER PUMP: PRESSURE WASHER MARKET, BY REGION, 2022–2025 (USD MILLION)


TABLE 31
WATER PUMP: PRESSURE WASHER MARKET, BY REGION, 2026–2032 (USD MILLION)


TABLE 32
ELECTRIC MOTOR/GAS ENGINE: PRESSURE WASHER MARKET, BY REGION, 2022–2025 (USD MILLION)


TABLE 33
ELECTRIC MOTOR/GAS ENGINE: PRESSURE WASHER MARKET, BY REGION, 2026–2032 (USD MILLION)


TABLE 34
HIGH-PRESSURE HOSE: PRESSURE WASHER MARKET, BY REGION, 2022–2025 (USD MILLION)


TABLE 35
HIGH-PRESSURE HOSE: PRESSURE WASHER MARKET, BY REGION, 2026–2032 (USD MILLION)


TABLE 36
NOZZLE: PRESSURE WASHER MARKET, BY REGION, 2022–2025 (USD MILLION)


TABLE 37
NOZZLE: PRESSURE WASHER MARKET, BY REGION, 2026–2032 (USD MILLION)


TABLE 38
OTHER COMPONENTS: PRESSURE WASHER MARKET, BY REGION, 2022–2025 (USD MILLION)


TABLE 39
OTHER COMPONENTS: PRESSURE WASHER MARKET, BY REGION, 2026–2032 (USD MILLION)


TABLE 40
PRESSURE WASHER MARKET, BY TYPE, 2022–2025 (USD MILLION)


TABLE 41
PRESSURE WASHER MARKET, BY TYPE, 2026–2032 (USD MILLION)


TABLE 42
PRESSURE WASHER MARKET, BY TYPE, 2022–2025 (MILLION UNITS)


TABLE 43
PRESSURE WASHER MARKET, BY TYPE, 2026–2032 (MILLION UNITS)


TABLE 44
PORTABLE PRESSURE WASHER MARKET, BY POWER SOURCE, 2022–2025 (USD MILLION)


TABLE 45
PORTABLE PRESSURE WASHER MARKET, BY POWER SOURCE, 2026–2032 (USD MILLION)


TABLE 46
PORTABLE PRESSURE WASHER MARKET, BY REGION, 2022–2025 (USD MILLION)


TABLE 47
PORTABLE PRESSURE WASHER MARKET, BY REGION, 2026–2032 (USD MILLION)


TABLE 48
NON-PORTABLE: PRESSURE WASHER MARKET, BY POWER SOURCE, 2022–2025 (USD MILLION)


TABLE 49
NON-PORTABLE: PRESSURE WASHER MARKET, BY POWER SOURCE, 2026–2032 (USD MILLION)


TABLE 50
NON-PORTABLE: PRESSURE WASHER MARKET, BY REGION, 2022–2025 (USD MILLION)


TABLE 51
NON-PORTABLE: PRESSURE WASHER MARKET, BY REGION, 2026–2032 (USD MILLION)


TABLE 52
PRESSURE WASHER MARKET, BY POWER SOURCE, 2022–2025 (USD MILLION)


TABLE 53
PRESSURE WASHER MARKET, BY POWER SOURCE, 2026–2032 (USD MILLION)


TABLE 54
PRESSURE WASHER MARKET, BY POWER SOURCE, 2022–2025 (MILLION UNITS)


TABLE 55
PRESSURE WASHER MARKET, BY POWER SOURCE, 2026–2032 (MILLION UNITS)


TABLE 56
ELECTRIC: PRESSURE WASHER MARKET, BY TYPE, 2022–2025 (USD MILLION)


TABLE 57
ELECTRIC: PRESSURE WASHER MARKET, BY TYPE, 2026–2032 (USD MILLION)


TABLE 58
ELECTRIC: PRESSURE WASHER MARKET, BY POWER SOURCE TYPE, 2022–2025 (USD MILLION)


TABLE 59
ELECTRIC: PRESSURE WASHER MARKET, BY POWER SOURCE TYPE, 2026–2032 (USD MILLION)


TABLE 60
ELECTRIC: PRESSURE WASHER MARKET, BY REGION, 2022–2025 (USD MILLION)


TABLE 61
ELECTRIC: PRESSURE WASHER MARKET, BY REGION, 2026–2032 (USD MILLION)


TABLE 62
GAS: PRESSURE WASHER MARKET, BY TYPE, 2022–2025 (USD MILLION)


TABLE 63
GAS: PRESSURE WASHER MARKET, BY TYPE, 2026–2032 (USD MILLION)


TABLE 64
GAS: PRESSURE WASHER MARKET, BY REGION, 2022–2025 (USD MILLION)


TABLE 65
GAS: PRESSURE WASHER MARKET, BY REGION, 2026–2032 (USD MILLION)


TABLE 66
PRESSURE WASHER MARKET, BY WATER OPERATION, 2022–2025 (USD MILLION)


TABLE 67
PRESSURE WASHER MARKET, BY WATER OPERATION, 2026–2032 (USD MILLION)


TABLE 68
HOT WATER PRESSURE WASHER (HPW): PRESSURE WASHER MARKET, BY APPLICATION, 2022–2025 (USD MILLION)


TABLE 69
HOT WATER PRESSURE WASHER (HPW): PRESSURE WASHER MARKET, BY APPLICATION, 2026–2032 (USD MILLION)


TABLE 70
COLD WATER PRESSURE WASHER (CPW): PRESSURE WASHER MARKET, BY APPLICATION, 2022–2025 (USD MILLION)


TABLE 71
COLD WATER PRESSURE WASHER (CPW): PRESSURE WASHER MARKET, BY APPLICATION, 2026–2032 (USD MILLION)


TABLE 72
PRESSURE WASHER MARKET, BY PRESSURE, 2022–2025 (USD MILLION)


TABLE 73
PRESSURE WASHER MARKET, BY PRESSURE, 2026–2032 (USD MILLION)


TABLE 74
<103 BAR: PRESSURE WASHER MARKET, BY APPLICATION, 2022–2025 (USD MILLION)


TABLE 75
<103 BAR: PRESSURE WASHER MARKET, BY APPLICATION, 2026–2032 (USD MILLION)


TABLE 76
103–207 BAR: PRESSURE WASHER MARKET, BY APPLICATION, 2022–2025 (USD MILLION)


TABLE 77
103–207 BAR: PRESSURE WASHER MARKET, BY APPLICATION, 2026–2032 (USD MILLION)


TABLE 78
>207–276 BAR: PRESSURE WASHER MARKET, BY APPLICATION, 2022–2025 (USD MILLION)


TABLE 79
>207–276 BAR: PRESSURE WASHER MARKET, BY APPLICATION, 2026–2032 (USD MILLION)


TABLE 80
>276 BAR: PRESSURE WASHER MARKET, BY APPLICATION, 2022–2025 (USD MILLION)


TABLE 81
>276 BAR: PRESSURE WASHER MARKET, BY APPLICATION, 2026–2032 (USD MILLION)


TABLE 82
PRESSURE WASHER MARKET, BY SALES CHANNEL, 2022–2025 (USD MILLION)


TABLE 83
PRESSURE WASHER MARKET, BY SALES CHANNEL, 2026–2032 (USD MILLION)


TABLE 84
PRESSURE WASHER MARKET, BY APPLICATION, 2022–2025 (USD MILLION)


TABLE 85
PRESSURE WASHER MARKET, BY APPLICATION, 2026–2032 (USD MILLION)


TABLE 86
COMMERCIAL: PRESSURE WASHER MARKET, BY WATER OPERATION, 2022–2025 (USD MILLION)


TABLE 87
COMMERCIAL: PRESSURE WASHER MARKET, BY WATER OPERATION, 2026–2032 (USD MILLION)


TABLE 88
COMMERCIAL: PRESSURE WASHER MARKET, BY PRESSURE, 2022–2025 (USD MILLION)


TABLE 89
COMMERCIAL: PRESSURE WASHER MARKET, BY PRESSURE, 2026–2032 (USD MILLION)


TABLE 90
COMMERCIAL: PRESSURE WASHER MARKET, BY REGION, 2022–2025 (USD MILLION)


TABLE 91
COMMERCIAL: PRESSURE WASHER MARKET, BY REGION, 2026–2032 (USD MILLION)


TABLE 92
RESIDENTIAL/DIY: PRESSURE WASHER MARKET, BY WATER OPERATION, 2022–2025 (USD MILLION)


TABLE 93
RESIDENTIAL/DIY: PRESSURE WASHER MARKET, BY WATER OPERATION, 2026–2032 (USD MILLION)


TABLE 94
RESIDENTIAL/DIY: PRESSURE WASHER MARKET, BY PRESSURE, 2022–2025 (USD MILLION)


TABLE 95
RESIDENTIAL/DIY: PRESSURE WASHER MARKET, BY PRESSURE, 2026–2032 (USD MILLION)


TABLE 96
RESIDENTIAL/DIY: PRESSURE WASHER MARKET, BY REGION, 2022–2025 (USD MILLION)


TABLE 97
RESIDENTIAL/DIY: PRESSURE WASHER MARKET, BY REGION, 2026–2032 (USD MILLION)


TABLE 98
INDUSTRIAL: PRESSURE WASHER MARKET, BY WATER OPERATION, 2022–2025 (USD MILLION)


TABLE 99
INDUSTRIAL: PRESSURE WASHER MARKET, BY WATER OPERATION, 2026–2032 (USD MILLION)


TABLE 100
INDUSTRIAL: PRESSURE WASHER MARKET, BY PRESSURE, 2022–2025 (USD MILLION)


TABLE 101
INDUSTRIAL: PRESSURE WASHER MARKET, BY PRESSURE, 2026–2032 (USD MILLION)


TABLE 102
INDUSTRIAL: PRESSURE WASHER MARKET, BY REGION, 2022–2025 (USD MILLION)


TABLE 103
INDUSTRIAL: PRESSURE WASHER MARKET, BY REGION, 2026–2032 (USD MILLION)


TABLE 104
PRESSURE WASHER MARKET, BY REGION, 2022–2025 (USD MILLION)


TABLE 105
PRESSURE WASHER MARKET, BY REGION, 2026–2032 (USD MILLION)


TABLE 106
NORTH AMERICA: PRESSURE WASHER MARKET, BY COUNTRY, 2022–2025 (USD MILLION)


TABLE 107
NORTH AMERICA: PRESSURE WASHER MARKET, BY COUNTRY, 2026–2032 (USD MILLION)


TABLE 108
NORTH AMERICA: PRESSURE WASHER MARKET, BY TYPE, 2022–2025 (USD MILLION)


TABLE 109
NORTH AMERICA: PRESSURE WASHER MARKET, BY TYPE, 2026–2032 (USD MILLION)


TABLE 110
NORTH AMERICA: PRESSURE WASHER MARKET, BY APPLICATION, 2022–2025 (USD MILLION)


TABLE 111
NORTH AMERICA: PRESSURE WASHER MARKET, BY APPLICATION, 2026–2032 (USD MILLION)


TABLE 112
NORTH AMERICA: PRESSURE WASHER MARKET, BY COMPONENT, 2022–2025 (USD MILLION)


TABLE 113
NORTH AMERICA: PRESSURE WASHER MARKET, BY COMPONENT, 2026–2032 (USD MILLION)


TABLE 114
US: PRESSURE WASHER MARKET, BY APPLICATION, 2022–2025 (USD MILLION)


TABLE 115
US: PRESSURE WASHER MARKET, BY APPLICATION, 2026–2032 (USD MILLION)


TABLE 116
CANADA: PRESSURE WASHER MARKET, BY APPLICATION, 2022–2025 (USD MILLION)


TABLE 117
CANADA: PRESSURE WASHER MARKET, BY APPLICATION, 2026–2032 (USD MILLION)


TABLE 118
MEXICO: PRESSURE WASHER MARKET, BY APPLICATION, 2022–2025 (USD MILLION)


TABLE 119
MEXICO: PRESSURE WASHER MARKET, BY APPLICATION, 2026–2032 (USD MILLION)


TABLE 120
EUROPE: PRESSURE WASHER MARKET, BY COUNTRY, 2022–2025 (USD MILLION)


TABLE 121
EUROPE: PRESSURE WASHER MARKET, BY COUNTRY, 2026–2032 (USD MILLION)


TABLE 122
EUROPE: PRESSURE WASHER MARKET, BY TYPE, 2022–2025 (USD MILLION)


TABLE 123
EUROPE: PRESSURE WASHER MARKET, BY TYPE, 2026–2032 (USD MILLION)


TABLE 124
EUROPE: PRESSURE WASHER MARKET, BY APPLICATION, 2022–2025 (USD MILLION)


TABLE 125
EUROPE: PRESSURE WASHER MARKET, BY APPLICATION, 2026–2032 (USD MILLION)


TABLE 126
EUROPE: PRESSURE WASHER MARKET, BY COMPONENT, 2022–2025 (USD MILLION)


TABLE 127
EUROPE: PRESSURE WASHER MARKET, BY COMPONENT, 2026–2032 (USD MILLION)


TABLE 128
GERMANY: PRESSURE WASHER MARKET, BY APPLICATION, 2022–2025 (USD MILLION)


TABLE 129
GERMANY: PRESSURE WASHER MARKET, BY APPLICATION, 2026–2032 (USD MILLION)


TABLE 130
UK: PRESSURE WASHER MARKET, BY APPLICATION, 2022–2025 (USD MILLION)


TABLE 131
UK: PRESSURE WASHER MARKET, BY APPLICATION, 2026–2032 (USD MILLION)


TABLE 132
FRANCE: PRESSURE WASHER MARKET, BY APPLICATION, 2022–2025 (USD MILLION)


TABLE 133
FRANCE: PRESSURE WASHER MARKET, BY APPLICATION, 2026–2032 (USD MILLION)


TABLE 134
ITALY: PRESSURE WASHER MARKET, BY APPLICATION, 2022–2025 (USD MILLION)


TABLE 135
ITALY: PRESSURE WASHER MARKET, BY APPLICATION, 2026–2032 (USD MILLION)


TABLE 136
SPAIN: PRESSURE WASHER MARKET, BY APPLICATION, 2022–2025 (USD MILLION)


TABLE 137
SPAIN: PRESSURE WASHER MARKET, BY APPLICATION, 2026–2032 (USD MILLION)


TABLE 138
POLAND: PRESSURE WASHER MARKET, BY APPLICATION, 2022–2025 (USD MILLION)


TABLE 139
POLAND: PRESSURE WASHER MARKET, BY APPLICATION, 2026–2032 (USD MILLION)


TABLE 140
NORDICS: PRESSURE WASHER MARKET, BY APPLICATION, 2022–2025 (USD MILLION)


TABLE 141
NORDICS: PRESSURE WASHER MARKET, BY APPLICATION, 2026–2032 (USD MILLION)


TABLE 142
REST OF EUROPE: PRESSURE WASHER MARKET, BY APPLICATION, 2022–2025 (USD MILLION)


TABLE 143
REST OF EUROPE: PRESSURE WASHER MARKET, BY APPLICATION, 2026–2032 (USD MILLION)


TABLE 144
ASIA PACIFIC: PRESSURE WASHER MARKET, BY COUNTRY, 2022–2025 (USD MILLION)


TABLE 145
ASIA PACIFIC: PRESSURE WASHER MARKET, BY COUNTRY, 2026–2032 (USD MILLION)


TABLE 146
ASIA PACIFIC: PRESSURE WASHER MARKET, BY TYPE, 2022–2025 (USD MILLION)


TABLE 147
ASIA PACIFIC: PRESSURE WASHER MARKET, BY TYPE, 2026–2032 (USD MILLION)


TABLE 148
ASIA PACIFIC: PRESSURE WASHER MARKET, BY APPLICATION, 2022–2025 (USD MILLION)


TABLE 149
ASIA PACIFIC: PRESSURE WASHER MARKET, BY APPLICATION, 2026–2032 (USD MILLION)


TABLE 150
ASIA PACIFIC: PRESSURE WASHER MARKET, BY COMPONENT, 2022–2025 (USD MILLION)


TABLE 151
ASIA PACIFIC: PRESSURE WASHER MARKET, BY COMPONENT, 2026–2032 (USD MILLION)


TABLE 152
CHINA: PRESSURE WASHER MARKET, BY APPLICATION, 2022–2025 (USD MILLION)


TABLE 153
CHINA: PRESSURE WASHER MARKET, BY APPLICATION, 2026–2032 (USD MILLION)


TABLE 154
JAPAN: PRESSURE WASHER MARKET, BY APPLICATION, 2022–2025 (USD MILLION)


TABLE 155
JAPAN: PRESSURE WASHER MARKET, BY APPLICATION, 2026–2032 (USD MILLION)


TABLE 156
SOUTH KOREA: PRESSURE WASHER MARKET, BY APPLICATION, 2022–2025 (USD MILLION)


TABLE 157
SOUTH KOREA: PRESSURE WASHER MARKET, BY APPLICATION, 2026–2032 (USD MILLION)


TABLE 158
INDIA: PRESSURE WASHER MARKET, BY APPLICATION, 2022–2025 (USD MILLION)


TABLE 159
INDIA: PRESSURE WASHER MARKET, BY APPLICATION, 2026–2032 (USD MILLION)


TABLE 160
AUSTRALIA: PRESSURE WASHER MARKET, BY APPLICATION, 2022–2025 (USD MILLION)


TABLE 161
AUSTRALIA: PRESSURE WASHER MARKET, BY APPLICATION, 2026–2032 (USD MILLION)


TABLE 162
INDONESIA: PRESSURE WASHER MARKET, BY APPLICATION, 2022–2025 (USD MILLION)


TABLE 163
INDONESIA: PRESSURE WASHER MARKET, BY APPLICATION, 2026–2032 (USD MILLION)


TABLE 164
MALAYSIA: PRESSURE WASHER MARKET, BY APPLICATION, 2022–2025 (USD MILLION)


TABLE 165
MALAYSIA: PRESSURE WASHER MARKET, BY APPLICATION, 2026–2032 (USD MILLION)


TABLE 166
THAILAND: PRESSURE WASHER MARKET, BY APPLICATION, 2022–2025 (USD MILLION)


TABLE 167
THAILAND: PRESSURE WASHER MARKET, BY APPLICATION, 2026–2032 (USD MILLION)


TABLE 168
VIETNAM: PRESSURE WASHER MARKET, BY APPLICATION, 2022–2025 (USD MILLION)


TABLE 169
VIETNAM: PRESSURE WASHER MARKET, BY APPLICATION, 2026–2032 (USD MILLION)


TABLE 170
REST OF ASIA PACIFIC: PRESSURE WASHER MARKET, BY APPLICATION, 2022–2025 (USD MILLION)


TABLE 171
REST OF ASIA PACIFIC: PRESSURE WASHER MARKET, BY APPLICATION, 2026–2032 (USD MILLION)


TABLE 172
ROW: PRESSURE WASHER MARKET, BY REGION, 2022–2025 (USD MILLION)


TABLE 173
ROW: PRESSURE WASHER MARKET, BY REGION, 2026–2032 (USD MILLION)


TABLE 174
ROW: PRESSURE WASHER MARKET, BY TYPE, 2022–2025 (USD MILLION)


TABLE 175
ROW: PRESSURE WASHER MARKET, BY TYPE, 2026–2032 (USD MILLION)


TABLE 176
ROW: PRESSURE WASHER MARKET, BY APPLICATION, 2022–2025 (USD MILLION)


TABLE 177
ROW: PRESSURE WASHER MARKET, BY APPLICATION, 2026–2032 (USD MILLION)


TABLE 178
ROW: PRESSURE WASHER MARKET, BY COMPONENT, 2022–2025 (USD MILLION)


TABLE 179
ROW: PRESSURE WASHER MARKET, BY COMPONENT, 2026–2032 (USD MILLION)


TABLE 180
MIDDLE EAST: PRESSURE WASHER MARKET, BY COUNTRY, 2022–2025 (USD MILLION)


TABLE 181
MIDDLE EAST: PRESSURE WASHER MARKET, BY COUNTRY, 2026–2032 (USD MILLION)


TABLE 182
MIDDLE EAST: PRESSURE WASHER MARKET, BY APPLICATION, 2022–2025 (USD MILLION)


TABLE 183
MIDDLE EAST: PRESSURE WASHER MARKET, BY APPLICATION, 2026–2032 (USD MILLION)


TABLE 184
SOUTH AMERICA: PRESSURE WASHER MARKET, BY APPLICATION, 2022–2025 (USD MILLION)


TABLE 185
SOUTH AMERICA: PRESSURE WASHER MARKET, BY APPLICATION, 2026–2032 (USD MILLION)


TABLE 186
AFRICA: PRESSURE WASHER MARKET, BY APPLICATION, 2022–2025 (USD MILLION)


TABLE 187
AFRICA: PRESSURE WASHER MARKET, BY APPLICATION, 2026–2032 (USD MILLION)


TABLE 188
PRESSURE WASHER MARKET: OVERVIEW OF STRATEGIES ADOPTED BY KEY PLAYERS, JANUARY 2023–OCTOBER 2026


TABLE 189
PRESSURE WASHER MARKET: DEGREE OF COMPETITION, 2025


TABLE 190
PRESSURE WASHER MARKET: REGION FOOTPRINT


TABLE 191
PRESSURE WASHER MARKET: TYPE FOOTPRINT


TABLE 192
PRESSURE WASHER MARKET: POWER SOURCE FOOTPRINT


TABLE 193
PRESSURE WASHER MARKET: WATER OPERATION FOOTPRINT


TABLE 194
PRESSURE WASHER MARKET: APPLICATION FOOTPRINT


TABLE 195
PRESSURE WASHER MARKET: DETAILED LIST OF KEY STARTUPS/SMES


TABLE 196
PRESSURE WASHER MARKET: COMPETITIVE BENCHMARKING OF KEY STARTUPS/SMES


TABLE 197
PRESSURE WASHER MARKET: PRODUCT LAUNCHES, JANUARY 2023–OCTOBER 2026


TABLE 198
PRESSURE WASHER MARKET: OTHER DEVELOPMENTS, JANUARY 2023–OCTOBER 2026


TABLE 199
ALFRED KÄRCHER SE & CO. KG: COMPANY OVERVIEW


TABLE 200
ALFRED KÄRCHER SE & CO. KG: PRODUCTS/SOLUTIONS/SERVICES OFFERED


TABLE 201
ALFRED KÄRCHER SE & CO. KG: PRODUCT LAUNCHES


TABLE 202
GENERAC POWER SYSTEMS, INC.: COMPANY OVERVIEW


TABLE 203
GENERAC POWER SYSTEMS, INC.: PRODUCTS/SOLUTIONS/SERVICES OFFERED


TABLE 204
TECHTRONIC INDUSTRIES CO. LTD: COMPANY OVERVIEW


TABLE 205
TECHTRONIC INDUSTRIES CO. LTD.: PRODUCTS/SOLUTIONS/SERVICES OFFERED


TABLE 206
TECHTRONIC INDUSTRIES CO. LTD.: PRODUCT LAUNCHES


TABLE 207
STANLEY BLACK & DECKER, INC.: COMPANY OVERVIEW


TABLE 208
STANLEY BLACK & DECKER, INC.: PRODUCTS/SOLUTIONS/SERVICES OFFERED


TABLE 209
STANLEY BLACK & DECKER, INC.: PRODUCT LAUNCHES


TABLE 210
NILFISK GROUP: COMPANY OVERVIEW


TABLE 211
NILFISK GROUP: PRODUCTS/SOLUTIONS/SERVICES OFFERED


TABLE 212
NILFISK GROUP: PRODUCT LAUNCHES


TABLE 213
NILFISK GROUP: OTHER DEVELOPMENTS


TABLE 214
ALKOTA CLEANING SYSTEMS INC.: COMPANY OVERVIEW


TABLE 215
ALKOTA CLEANING SYSTEMS INC.: PRODUCTS/SOLUTIONS/SERVICES OFFERED


TABLE 216
ANNOVI REVERBERI SPA: COMPANY OVERVIEW


TABLE 217
ANNOVI REVERBERI SPA: PRODUCTS/SOLUTIONS/SERVICES OFFERED


TABLE 218
ANNOVI REVERBERI SPA: PRODUCT LAUNCHES


TABLE 219
MI-T-M CORPORATION: COMPANY OVERVIEW


TABLE 220
MI-T-M CORPORATION: PRODUCTS/SOLUTIONS/SERVICES OFFERED


TABLE 221
FNA GROUP: COMPANY OVERVIEW


TABLE 222
FNA GROUP: PRODUCTS/SOLUTIONS/SERVICES OFFERED


TABLE 223
SHOP JOE: COMPANY OVERVIEW


TABLE 224
SHOP JOE: PRODUCTS/SOLUTIONS/SERVICES OFFERED


TABLE 225
DEERE & COMPANY: COMPANY OVERVIEW


TABLE 226
DEERE & COMPANY: PRODUCTS/SOLUTIONS/SERVICES OFFERED


TABLE 227
ROBERT BOSCH POWER TOOLS GMBH: COMPANY OVERVIEW


TABLE 228
ROBERT BOSCH POWER TOOLS GMBH: PRODUCTS/SOLUTIONS/SERVICES OFFERED


TABLE 229
HUSQVARNA GROUP: COMPANY OVERVIEW


TABLE 230
HUSQVARNA GROUP: PRODUCTS/SOLUTIONS/SERVICES OFFERED


TABLE 231
BRIGGS & STRATTON: COMPANY OVERVIEW


TABLE 232
BRIGGS & STRATTON: PRODUCTS/SOLUTIONS/SERVICES OFFERED


TABLE 233
IP CLEANING SRL: COMPANY OVERVIEW


TABLE 234
IP CLEANING SRL: PRODUCTS/SOLUTIONS/SERVICES OFFERED


TABLE 235
ANLU: COMPANY OVERVIEW


TABLE 236
STIHL INCORPORATED: COMPANY OVERVIEW


TABLE 237
EMAK S.P.A: COMPANY OVERVIEW


TABLE 238
SNAP-ON INCORPORATED: COMPANY OVERVIEW


TABLE 239
WEN PRODUCTS: COMPANY OVERVIEW


TABLE 240
BE POWER EQUIPMENT: COMPANY OVERVIEW


TABLE 241
KOKI HOLDINGS CO., LTD: COMPANY OVERVIEW


TABLE 242
VORTEX INDUSTRIES INC.: COMPANY OVERVIEW


TABLE 243
TAIZHOU BISON MACHINERY CO., LTD: COMPANY OVERVIEW


TABLE 244
KYNKO INDUSTRIAL LIMITED: COMPANY OVERVIEW


TABLE 245
DATA CAPTURED FROM PRIMARY SOURCES


TABLE 246
PRESSURE WASHER MARKET: RESEARCH ASSUMPTIONS


TABLE 247
PRESSURE WASHER MARKET: RISK ANALYSIS


LIST OF FIGURES


FIGURE 1
PRESSURE WASHER MARKET SEGMENTATION AND REGIONAL SCOPE


FIGURE 2
PRESSURE WASHER MARKET: DURATION CONSIDERED


FIGURE 3
PRESSURE WASHER MARKET SCENARIO


FIGURE 4
GLOBAL PRESSURE WASHER MARKET SIZE, 2022–2032


FIGURE 5
MAJOR STRATEGIES ADOPTED BY KEY PLAYERS IN PRESSURE WASHER MARKET, 2023–2026


FIGURE 6
DISRUPTIONS INFLUENCING GROWTH OF PRESSURE WASHER MARKET


FIGURE 7
HIGH-GROWTH SEGMENTS IN PRESSURE WASHER MARKET, 2026–2032


FIGURE 8
ASIA PACIFIC TO REGISTER HIGHEST CAGR IN PRESSURE WASHER MARKET, IN TERMS OF VALUE, DURING FORECAST PERIOD


FIGURE 9
RAPID URBANIZATION AND DEMAND FOR EFFICIENT CLEANING SOLUTIONS TO ACCELERATE MARKET GROWTH


FIGURE 10
PORTABLE SEGMENT TO HOLD MAJORITY OF MARKET SHARE IN 2026


FIGURE 11
ELECTRIC MOTOR/GAS ENGINE SEGMENT TO RECORD HIGHEST CAGR FROM 2026 TO 2032


FIGURE 12
OFFLINE SEGMENT TO ACCOUNT FOR LARGER MARKET SHARE IN 2032


FIGURE 13
COMMERCIAL SEGMENT TO WITNESS HIGHEST CAGR BETWEEN 2026 AND 2032


FIGURE 14
JAPAN TO RECORD HIGHEST CAGR IN GLOBAL PRESSURE WASHER MARKET DURING FORECAST PERIOD


FIGURE 15
DRIVERS, RESTRAINTS, OPPORTUNITIES, AND CHALLENGES


FIGURE 16
IMPACT ANALYSIS: DRIVERS


FIGURE 17
IMPACT ANALYSIS: RESTRAINTS


FIGURE 18
IMPACT ANALYSIS: OPPORTUNITIES


FIGURE 19
IMPACT ANALYSIS: CHALLENGES


FIGURE 20
PORTER’S FIVE FORCES ANALYSIS


FIGURE 21
PRESSURE WASHER VALUE CHAIN ANALYSIS


FIGURE 22
PRESSURE WASHER ECOSYSTEM


FIGURE 23
ASP TREND OF PRESSURE WASHERS, BY REGION, 2022–2025


FIGURE 24
IMPORT DATA FOR HS CODE 842430-COMPLIANT PRODUCTS FOR TOP FIVE COUNTRIES, 2021–2025


FIGURE 25
EXPORT DATA FOR HS CODE 842430-COMPLIANT PRODUCTS FOR TOP FIVE COUNTRIES, 2021–2025


FIGURE 26
TRENDS/DISRUPTIONS INFLUENCING CUSTOMER BUSINESS


FIGURE 27
INVESTMENT AND FUNDING SCENARIO, 2022–2025


FIGURE 28
PATENTS APPLIED AND GRANTED, 2017–2026


FIGURE 29
STRATEGIC BUYING CRITERIA FOR PRESSURE WASHER MARKET


FIGURE 30
INFLUENCE OF STAKEHOLDERS ON BUYING PROCESS, BY APPLICATION


FIGURE 31
KEY BUYING CRITERIA, BY APPLICATION


FIGURE 32
ELECTRIC MOTOR/GAS ENGINE SEGMENT TO HOLD LARGEST MARKET SHARE IN 2026 AND 2032


FIGURE 33
PORTABLE SEGMENT TO HOLD LARGER SHARE OF PRESSURE WASHER MARKET IN 2026 AND 2032


FIGURE 34
ELECTRIC SEGMENT TO CAPTURE LARGER SHARE OF PRESSURE WASHER MARKET IN 2026 AND 2032


FIGURE 35
COLD WATER PRESSURE WASHER (CPW) SEGMENT TO RECORD HIGHER CAGR DURING FORECAST PERIOD


FIGURE 36
>207–276 BAR SEGMENT TO HOLD LARGEST SHARE OF PRESSURE WASHER MARKET IN 2026 AND 2032


FIGURE 37
OFFLINE SEGMENT TO HOLD LARGER SHARE OF PRESSURE WASHER MARKET IN 2026 AND 2032


FIGURE 38
COMMERCIAL SEGMENT TO WITNESS HIGHEST GROWTH RATE FROM 2026 TO 2032


FIGURE 39
ASIA PACIFIC TO REGISTER HIGHEST CAGR IN PRESSURE WASHER MARKET BETWEEN 2026 AND 2032


FIGURE 40
NORTH AMERICA: PRESSURE WASHER MARKET SNAPSHOT


FIGURE 41
EUROPE: PRESSURE WASHER MARKET SNAPSHOT


FIGURE 42
ASIA PACIFIC: PRESSURE WASHER MARKET SNAPSHOT


FIGURE 43
PRESSURE WASHER MARKET: REVENUE ANALYSIS OF KEY PLAYERS, 2021–2025


FIGURE 44
MARKET SHARE ANALYSIS OF KEY PLAYERS OFFERING PRESSURE WASHERS, 2025


FIGURE 45
COMPANY VALUATION


FIGURE 46
FINANCIAL METRICS (EV/EBITDA)


FIGURE 47
BRAND COMPARATIVE ANALYSIS


FIGURE 48
PRESSURE WASHER MARKET: COMPANY EVALUATION MATRIX (KEY PLAYERS), 2025


FIGURE 49
PRESSURE WASHER MARKET: COMPANY FOOTPRINT


FIGURE 50
PRESSURE WASHER MARKET: COMPANY EVALUATION MATRIX (STARTUPS/SMES), 2025


FIGURE 51
GENERAC POWER SYSTEMS, INC.: COMPANY SNAPSHOT


FIGURE 52
TECHTRONIC INDUSTRIES CO. LTD.: COMPANY SNAPSHOT


FIGURE 53
STANLEY BLACK & DECKER, INC.: COMPANY SNAPSHOT


FIGURE 54
NILFISK GROUP: COMPANY SNAPSHOT


FIGURE 55
DEERE & COMPANY: COMPANY SNAPSHOT


FIGURE 56
HUSQVARNA GROUP: COMPANY SNAPSHOT


FIGURE 57
PRESSURE WASHER MARKET: RESEARCH DESIGN


FIGURE 58
PRESSURE WASHER MARKET: BOTTOM-UP APPROACH


FIGURE 59
PRESSURE WASHER MARKET: TOP-DOWN APPROACH


FIGURE 60
PRESSURE WASHER MARKET SIZE ESTIMATION: SUPPLY SIDE


FIGURE 61
PRESSURE WASHER MARKET: DATA TRIANGULATION


FIGURE 62
PRESSURE WASHER MARKET: RESEARCH LIMITATIONS


Methodology

The research process for this technical, market-oriented, and commercial study of the pressure washer market included systematic gathering, recording, and analysis of data about companies operating in the market. It involved the extensive use of secondary sources, directories, and databases to identify and collect relevant information. In-depth interviews were conducted with various primary respondents, including experts from the pressure washer and related cleaning equipment industries, to obtain and verify critical qualitative and quantitative information, as well as to assess the growth prospects of the market. Key players in the pressure washer market were identified through secondary research, and their market positions were assessed through primary and secondary research. This included studying annual reports of leading players and interviewing key industry experts, such as CEOs, directors, and marketing executives.

Secondary Research

In the secondary research process, various secondary sources were referred to for identifying and collecting information relevant to this study. Secondary sources included annual reports, press releases, investor presentations, product information, industry reports, regulatory publications, company websites, directories, and databases. Secondary research was mainly conducted to obtain key information about the supply of pressure washers, the total pool of key players, segmentation of the market according to product types, power sources, applications, geographic markets, pressure ranges, and key developments from market- and industry-oriented perspectives.

Primary Research

In the primary research process, primary sources from the supply and demand sides were interviewed to obtain qualitative and quantitative information for this report. Primary sources from the supply side included experts such as CEOs, vice presidents, marketing directors, product specialists, subject-matter experts, consultants, and related key executives from major companies and organizations operating in the pressure washer market.

After the complete market engineering process (market statistics calculations, market breakdown, market size estimations, market forecasting, and data triangulation), extensive primary research was conducted to gather information and verify and validate the critical market numbers.

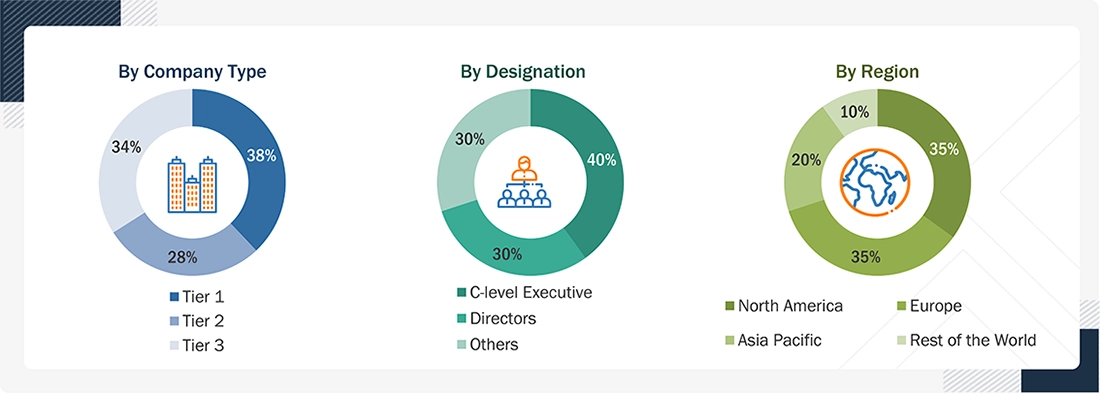
Several primary interviews were conducted with experts from the demand and supply sides across four major regions—North America, Europe, Asia Pacific, and Rest of the World (RoW). Approximately 25% of the primary interviews were conducted with the demand side and 75% with the supply side. This primary data was collected through questionnaires, emails, and telephonic interviews.

Breakdown Of Primary Interview Participants

Pressure Washer Market Size, and Share

Note: The 3 tiers of the companies are defined based on their total revenue as of 2025: tier 1 = >USD 500 million, tier 2 = USD 100 million to 500 million, and tier 3 = <USD 100 million. Other designations include sales, marketing specialists, and product managers. Rest of the World mainly includes the Middle East, Africa, and South America.

To know about the assumptions considered for the study, download the pdf brochure

Market Size Estimation

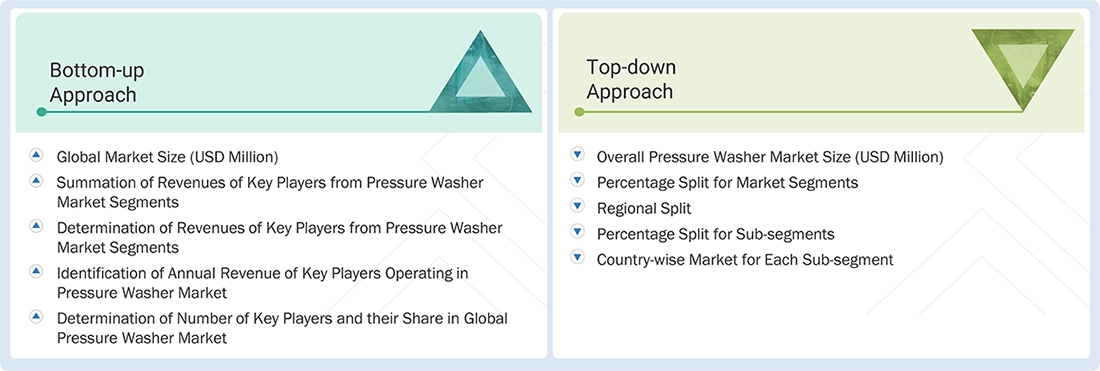
In the complete market estimation process, the top-down and bottom-up approaches, along with several data triangulation methods, were used to estimate and forecast the size of the pressure washer market and its segments and subsegments listed in the report. Extensive qualitative and quantitative analyses were carried out throughout the market engineering process to identify key information and insights pertaining to the pressure washer market.

Key players in the pressure washer market were identified through secondary research, and their positions across respective regions were assessed through primary and secondary research. This entire procedure involved the study of annual reports, financial reports, product information, press releases, and other corporate disclosures of leading players, along with interviews with industry experts, such as chief executive officers, vice presidents, directors, product specialists, and marketing executives, to obtain quantitative and qualitative insights. All percentage shares, splits, and breakdowns were determined using secondary sources and verified through primary sources. All parameters that affect the pressure washer market covered in this research study were accounted for, viewed in extensive detail, verified through primary research, and analyzed to obtain the final quantitative and qualitative data. This data was consolidated and enhanced with detailed inputs and analysis from MarketsandMarkets and presented in this report.

BOTTOM-UP APPROACH

  • Identifying entities in the pressure washer market that influence the entire market
  • Analyzing major manufacturers of pressure washers, studying their portfolios, and understanding different types of pressure washers
  • Analyzing trends pertaining to the use of different types of pressure washers for different kinds of applications
  • Tracking the ongoing and upcoming developments in the market, such as investments made, R&D activities, product launches, collaborations, and partnerships, and forecasting the market based on these developments and other critical parameters
  • Carrying out multiple discussions with key opinion leaders to understand different types of pressure washers, applications, and recent trends in the market, thereby analyzing the breakdown of the scope of work carried out by major companies
  • Arriving at the market estimates by analyzing revenues generated by companies and then combining the same to get the market estimate
  • Segmenting the overall market into various other market segments
  • Verifying and cross-checking the estimate at every level from the discussion with key opinion leaders such as CXOs, directors, and operations managers, and finally with the domain experts in MarketsandMarkets
  • Studying various paid and unpaid sources of information such as annual reports, press releases, white papers, and databases

TOP-DOWN APPROACH

  • Focusing on top-line investments and expenditures made in the pressure washer ecosystem
  • Building and developing information related to the revenue generated through offering key types of washers
  • Conducting multiple on-field discussions with key opinion leaders from the major companies involved in the development of pressure washers
  • Calculating the market size considering revenues generated by major players through the sales of pressure washers
  • Further segmenting based on R&D activities and key developments in major market areas
  • Further segmenting based on mapping the use of pressure washers for different applications
  • Estimating the geographic split using secondary sources based on various factors, such as the number of players in a specific country or region and the pressure washer offerings provided by these players.

Pressure Washer Market: Top-Down and Bottom-Up Approach

Pressure Washer Market Top Down and Bottom Up Approach

Data Triangulation

After arriving at the overall market size from the market size estimation process explained in the previous section, the total market was split into several segments and subsegments. Market breakdown and data triangulation procedures were employed, wherever applicable, to complete the overall market engineering process and arrive at the exact statistics for all segments and subsegments. The data were triangulated by studying various factors and trends from both the demand and supply sides. Along with this, the market was validated using both top-down and bottom-up approaches.      

Market Definition

The pressure washer market comprises businesses engaged in the design, manufacturing, and distribution of high-pressure cleaning equipment. These machines, ranging from compact residential units to heavy-duty industrial systems, use high-pressure water spray to remove dirt, grime, and other contaminants from surfaces such as vehicles, buildings, and pavements. Market growth is driven by rising construction activities, the expansion of car wash facilities, and increasing demand for efficient cleaning solutions across residential, commercial, and industrial sectors. Technological advancements and a growing emphasis on sustainability and water efficiency further support market development.

Key Stakeholders

  • Pressure washer manufacturers
  • Associations and industrial bodies
  • Government bodies, such as regulating authorities and policymakers
  • Financial institutions and investment communities
  • Market research and consulting firms
  • Raw material suppliers and distributors
  • Research institutes and organizations
  • Original equipment manufacturers (OEMs)
  • Pressure washer traders and suppliers

Report Objectives

  • To define, describe, and forecast the pressure washer market based on component, type, power source, water operation, pressure, application, and sales channel in terms of value
  • To describe and forecast the market for various segments in four main regions—North America, Europe, Asia Pacific, and the Rest of the World (RoW), in terms of value
  • To provide detailed information about the key factors, such as drivers, restraints, opportunities, and challenges, influencing the growth of the market
  • To describe and forecast the pressure washer market by type and power source in terms of volume
  • To analyze opportunities for stakeholders in the market by identifying the high-growth segments
  • To strategically analyze micromarkets with respect to individual growth trends, prospects, and contributions to the overall market
  • To benchmark players within the market using the proprietary ‘Company Evaluation Matrix’ framework, which analyzes market players on various parameters within the broad categories of market rank and product offerings
  • To strategically profile key players and comprehensively analyze their market shares and core competencies and provide a detailed competitive landscape for market leaders
  • To analyze competitive developments, such as partnerships, collaborations, agreements, mergers & acquisitions, expansions, and product launches & developments, in the pressure washer market

Available customizations:

With the given market data, MarketsandMarkets offers customizations according to the company’s specific needs. The following customization options are available for the report::

Company Information

  • Detailed analysis and profiling of additional market players (up to 5)


Key Questions Addressed by the Report

What is the global pressure washer market size?

The global pressure washer market is projected to reach USD 3.35 billion in 2026, according to the MarketsandMarkets report page.

What is the projected value of the pressure washer market by 2032?

The global pressure washer market is projected to reach USD 4.48 billion by 2032.

What is the expected CAGR of the pressure washer market from 2026 to 2032?

The market is projected to grow at a CAGR of 5.0% during 2026–2032.

What are the key growth drivers of the pressure washer market?

Key drivers include rising demand for outdoor cleaning across residential and commercial sectors, growth in automotive and transportation, and increasing demand for efficient cleaning in construction, facility management, and industrial applications.

What are the major trends shaping the pressure washer industry?

Major trends include increasing adoption of electric and cordless models, portable designs, water-efficient cleaning solutions, smart controls, and advanced pump technologies.

Which application segment is expected to grow fastest in the pressure washer market?

The commercial application segment is projected to register the highest CAGR of 5.4% during the forecast period, supported by cleaning needs across commercial facilities, automotive services, hospitality, retail, and property maintenance.

Which pressure washer type is expected to lead the market?

The portable segment is estimated to lead the market during the forecast period, reflecting demand for flexible and convenient equipment across residential, commercial, and professional uses.

Which region is projected to grow fastest in the pressure washer market?

Asia Pacific is projected to register the highest regional CAGR of 5.7%, supported by urbanization, industrialization, infrastructure development, and rising adoption across residential, commercial, automotive, construction, and industrial applications.

Who are the key companies in the pressure washer market?

Key companies identified by MarketsandMarkets include Alfred Kärcher SE & Co. KG, Techtronic Industries Co., Ltd., Generac Power Systems, Inc., Stanley Black & Decker, Inc., and Nilfisk Group.

What does the MarketsandMarkets pressure washer market report cover?

The report analyzes market size and forecasts, company rankings, competitive landscape, growth factors, trends, and segments by component, power source, pressure range, water operation, sales channel, type, application, and region. The current report page

Personalize This Research

  • Triangulate with your Own Data
  • Get Data as per your Format and Definition
  • Gain a Deeper Dive on a Specific Application, Geography, Customer or Competitor
  • Any level of Personalization
Request A Free Customisation

Let Us Help You

  • What are the Known and Unknown Adjacencies Impacting the Pressure Washer Market
  • What will your New Revenue Sources be?
  • Who will be your Top Customer; what will make them switch?
  • Defend your Market Share or Win Competitors
  • Get a Scorecard for Target Partners
Customized Workshop Request

Custom Market Research Services

We Will Customise The Research For You, In Case The Report Listed Above Does Not Meet With Your Requirements

Get 10% Free Customisation

TESTIMONIALS

Growth opportunities and latent adjacency in Pressure Washer Market

avtar

Andre

Apr, 2026

I appreciate the detailed segmentation by product type and end-user industry..

avtar

Jack

Apr, 2026

Is it feasible to add a comparison of consumer preferences for high-pressure vs. low-pressure washers?.

THIS REPORT TELLS YOU

How big the Pressure Washer market is, and who leads it.

GROWTHIQ TELLS YOU NEW

Where your company should play next, and who is taking your share.

Get your company's view of this market. Free snapshot.

DMCA.com Protection Status
popup img